K8S Series Part 01 - kubectl: How You Actually Talk to a Cluster
Before any of the fancy GitOps automation, there's one tool you reach for to see what the cluster is doing: kubectl. Even though I almost never use it to change things (that's Flux's job - article 02), I use it constantly to observe and debug. If you're new to Kubernetes, getting comfortable here pays off more than anything else. This article is the mental model plus the commands I actually type.
What is kubectl, really?
A Kubernetes cluster is, at heart, one component you talk to: the API server. It
holds the desired state of everything - every Deployment, Service, Secret - in a
database (etcd). Controllers running in the cluster constantly compare desired state to reality and act to close the gap.
kubectl is just a REST client for that API server. Every command becomes an HTTPS call.
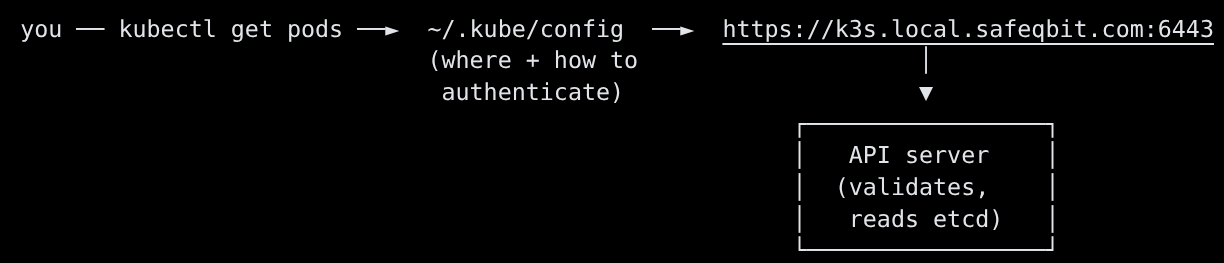
Two things make kubectl work:
- The kubeconfig (
~/.kube/configby default, or$KUBECONFIG). It says which cluster, which user/credentials, and which namespace. On K3s the admin config lives at/etc/rancher/k3s/k3s.yamlon a server node - copy it to your workstation and fix theserver:address to point at the cluster's API endpoint. - A context - a named "(cluster, user, namespace)" tuple. You can hold many and switch between them.
kubectl config get-contexts           # list contexts
kubectl config current-context        # which one am I pointed at?
kubectl config use-context safeqbit   # switch
kubectl config set-context --current --namespace=authentik   # default ns for this context
Tip that saved me hours: the single most common "why isn't this working" cause for beginners is being in the wrong namespace or wrong context. Check it first, always.
The object model in one breath
Everything in Kubernetes is an object with a kind. You'll meet these constantly:
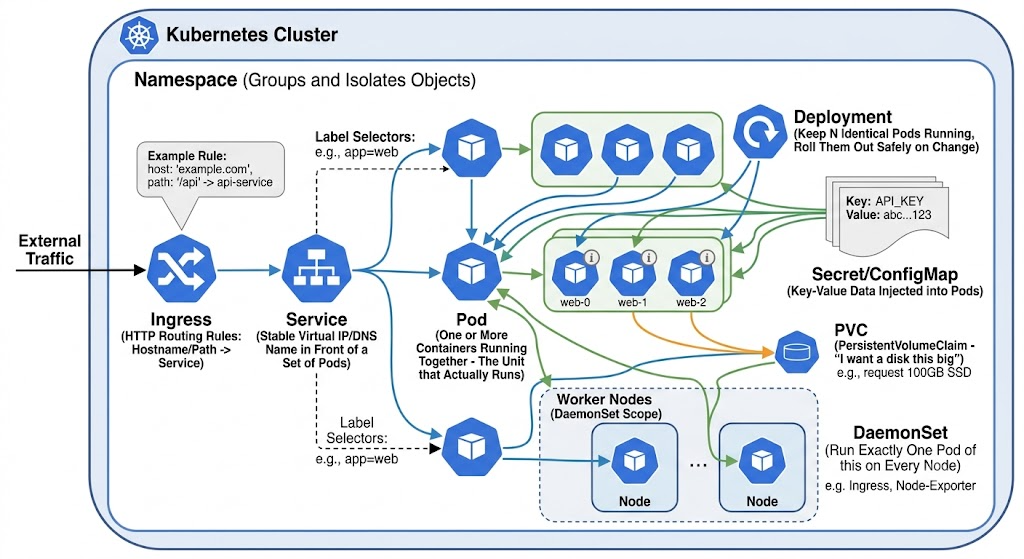
You don't memorize this. You recognize it, and you let kubectl explain teach you the fields when you need them:
kubectl explain deployment.spec.strategy   # what fields exist, what they mean
kubectl api-resources   # every kind your cluster knows about
The verbs you'll use 95% of the time
get - list things
kubectl get pods                       # pods in the current namespace
kubectl get pods -A                    # across ALL namespaces
kubectl get pods -n monitoring -o wide # include node + pod IP
kubectl get pods -w                    # watch - live-update as things change
kubectl get all -n affine              # common kinds in one namespace
Output worth reading like a dashboard:
NAME                              READY   STATUS    RESTARTS      AGE
authentik-server-7c9f8b6c-2xk4d   1/1     Running   0             6d
authentik-worker-5d4b9c7f-lm8p    1/1     Running   2 (3h ago)    6d
netbox-redis-0                    0/1     Pending   0             40s
READY 1/1= all containers in the pod are up.0/1= something's wrong.STATUS-Runningis good;Pending,CrashLoopBackOff,ImagePullBackOff,Error,Init:...each point you somewhere specific (see the playbook below).RESTARTSwith a recent timestamp means the container is dying and being restarted.
describe - the full story of one object
get tells you that something's wrong; describe usually tells you why. The
Events at the bottom are gold.
kubectl describe pod netbox-redis-0 -n netbox
Events:
  Type     Reason            Age   From               Message
  ----     ------            ----  ----               -------
  Warning  FailedScheduling  41s   default-scheduler  0/3 nodes available: 3 Insufficient memory.
There's the answer: nothing wrong with the image or config - the cluster just can't fit
the pod anywhere.
logs - what the app itself said
kubectl logs deploy/authentik-server -n authentik          # current logs
kubectl logs deploy/authentik-server -n authentik -f       # follow (tail -f)
kubectl logs <pod> -n <ns> --previous                       # logs from the CRASHED instance
kubectl logs <pod> -n <ns> -c <container> --since=1h        # one container, last hour
--previous is the one people forget. When a pod is in CrashLoopBackOff, the current
container may be too young to have logs - you want the logs from the instance that just
died.
exec - open a shell inside a running container
kubectl exec -it deploy/uptime-kuma -n uptime-kuma -- sh
# one-off command without a shell:
kubectl exec -n uptime-kuma deploy/uptime-kuma -- curl -sI https://affine.local.safeqbit.com
The -- separates kubectl's flags from the command you're running inside the
container. I lean on this for in-cluster network tests - "can this pod actually reach
that service?" is a question you answer from inside the pod, not from your laptop.
apply / delete - change things (sparingly, here)
kubectl apply -f some.yaml      # create or update to match the file
kubectl delete pod <name> -n <ns>   # delete (a Deployment will recreate it)
In a GitOps cluster you mostly don't run these by hand - Flux does. But deleting a pod
to force a clean restart is a legitimate, safe operation (the controller brings back a
fresh one), and apply --dry-run=server is great for validating a manifest.
A repeatable troubleshooting workflow
When something's broken, I follow the same funnel every time. Don't randomly poke - go
top to bottom.
   ┌───────────────────────────────────────────────────────────┐
   │ 1. WHERE is it?      kubectl get pods -A | grep -v Running│
   ├───────────────────────────────────────────────────────────┤
   │ 2. WHAT state?       Pending / CrashLoop / ImagePull / …  │
   ├───────────────────────────────────────────────────────────┤
   │ 3. WHY (events)?     kubectl describe pod <p> -n <ns>     │
   ├───────────────────────────────────────────────────────────┤
   │ 4. WHAT did it say?  kubectl logs <p> -n <ns> --previous  │
   ├───────────────────────────────────────────────────────────┤
   │ 5. PROVE the fix     re-check get; reproduce from inside  │
   └───────────────────────────────────────────────────────────┘
Decode the status, then act
| STATUS | Usually means | First thing to check |
|---|---|---|
Pending |
Scheduler can't place the pod | describe → Events: insufficient CPU/mem, no matching node, unbound PVC |
ContainerCreating (stuck) |
Volume won't mount or image still pulling | describe → Events: CSI/mount errors, large image |
ImagePullBackOff |
Can't pull the image | Wrong tag/registry, private registry without creds |
CrashLoopBackOff |
Container starts then exits repeatedly | logs --previous - bad config, missing secret, failed migration |
Running but 0/1 READY |
Failing its readiness probe | describe → probe config; logs; is the dependency (DB) up? |
Init:0/1 |
An initContainer hasn't finished | logs <pod> -c <init-container> |
Terminating (stuck) |
Finalizer or node gone | describe; check the node; last resort force-delete |
Cluster-level questions
kubectl get nodes -o wide                 # are all three nodes Ready?
kubectl describe node k3s-server-02       # capacity, pressure, taints
kubectl top nodes ; kubectl top pods -A   # live CPU/memory (needs metrics-server)
kubectl get events -A --sort-by=.lastTimestamp | tail -30   # what just happened, clusterwide
That last one - events sorted by time - is my "what changed in the last few minutes?"
command. Half the time it points straight at the problem.
When the network is the problem
Some of the nastiest issues aren't the app at all - they're connectivity between pods or
to a Service. Test from inside:
# DNS resolution inside the cluster
kubectl exec -n uptime-kuma deploy/uptime-kuma -- nslookup authentik-server.authentik.svc.cluster.local

# TCP reachability to a service IP / port
kubectl exec -n uptime-kuma deploy/uptime-kuma -- nc -zv 10.10.13.50 443

# does the Service have endpoints? (no endpoints = selector matches nothing)
kubectl get endpoints -n authentik authentik-server
A real one I experienced recently: after a node reboot, pods on different nodes couldn't talk over TCP even thoughpingworked. The cause was a NIC checksum-offload quirk breaking VXLAN - not anything in Kubernetes. The only reason I found it quickly was testing reachability from inside a pod and noticing ICMP succeeded while TCP/UDP hung.
Lesson: embrace the TCP/IP or the OSI model mindset when troubleshooting issues that look trivial.
Quality-of-life setup
A few things I set up early and never regretted:
alias k=kubectl
source <(kubectl completion bash)        # tab-completion for resources & names
export do="--dry-run=client -o yaml"     # scaffold manifests: k create deploy x --image=y $do
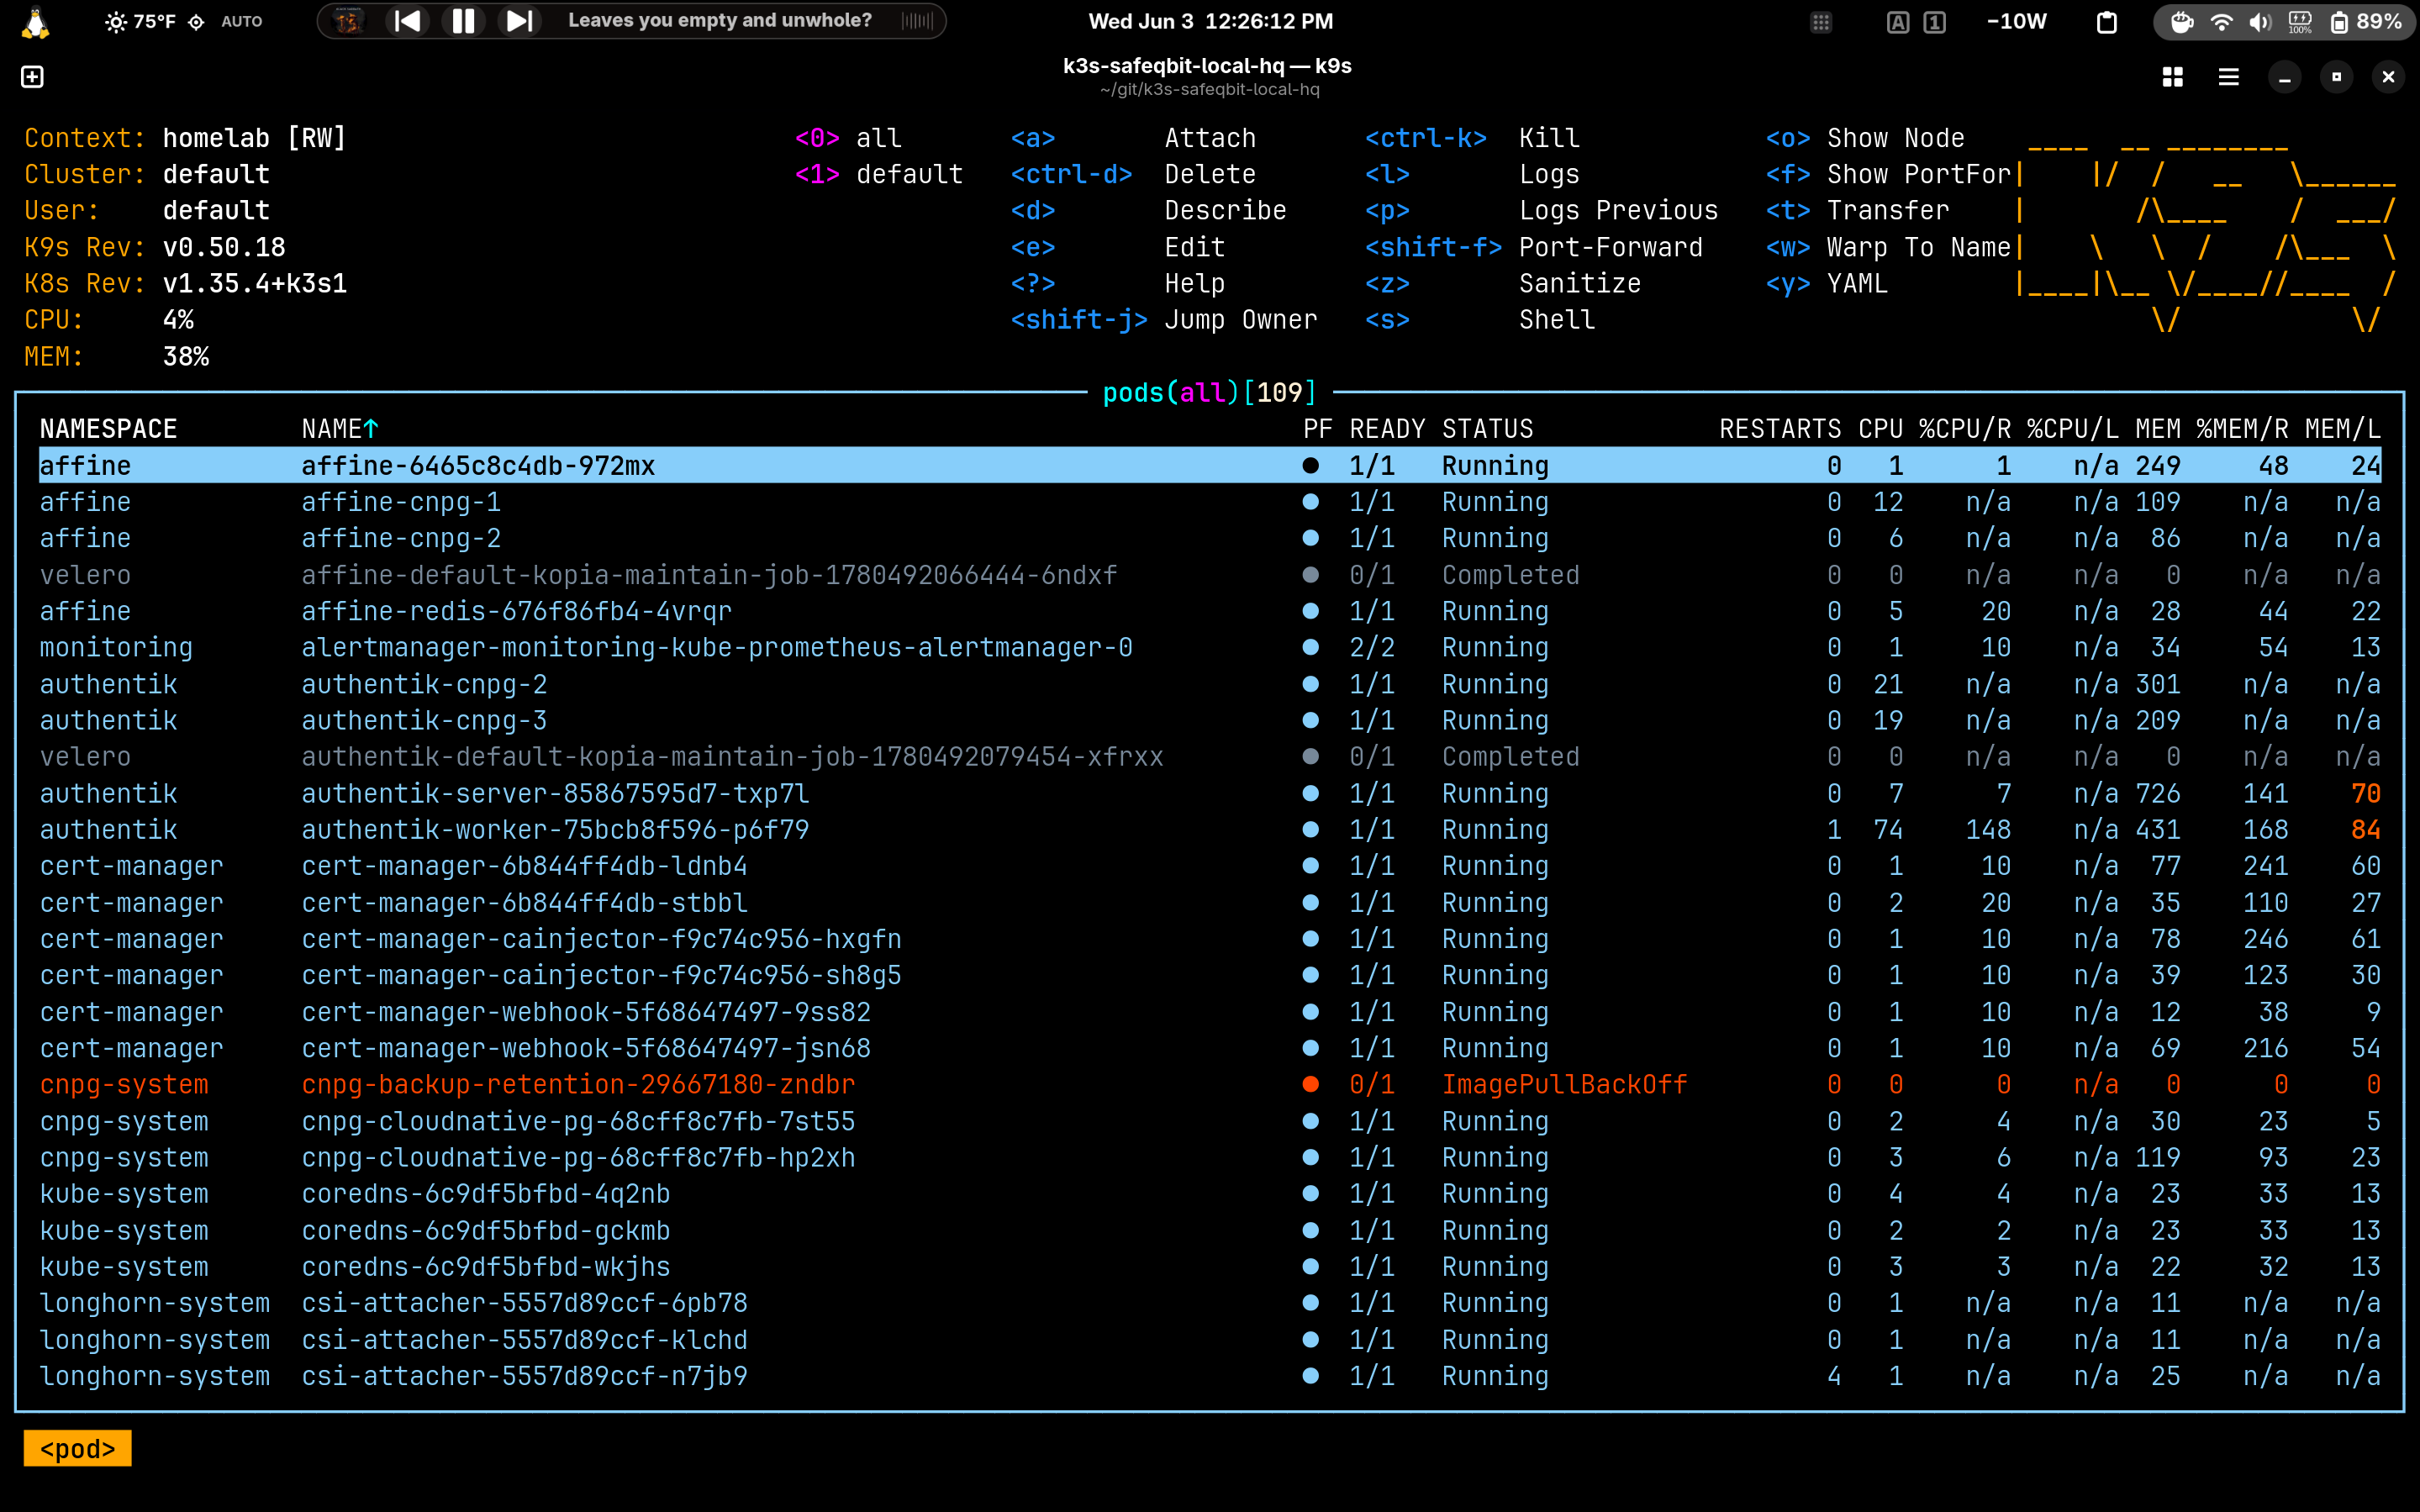
- k9s - a terminal UI over kubectl. For browsing and quick
log/exec it's far faster than typing. I still drop to rawkubectlfor anything
precise or scriptable.
kubectl explainbeats googling field names.- Set your namespace in the context so you stop typing
-nfor the app you're working on.
What to take away
kubectlis a REST client; the kubeconfig says where/who, the context bundles it up.get → describe → logs → execis the funnel. Events and--previouslogs are where
the answers usually hide.- Read pod STATUS as a signpost, not noise - each value points at a different layer.
- When the symptoms don't match the app, test connectivity from inside a pod and suspect
the layer below.
Now that you can see the cluster, the next question is how anything gets into it
without me running kubectl apply all day. That's GitOps.
Resources
This cluster
- k3s-safeqbit-local-hq repo - the manifests the example commands operate on
Documentation
- kubectl reference - every command and flag
- kubectl Quick Reference (cheat sheet) - the one to bookmark
- Organizing access with kubeconfig - contexts, clusters, users
- Debug Running Pods - the official troubleshooting tasks
- Kubernetes objects overview - the object model in depth
- K3s documentation - where the kubeconfig lives, cluster specifics
- k9s - the terminal UI I use for browsing
Next lesson → In GitOps with Flux, we'll delete the "works on my cluster" problem for good: how a single git push becomes running infrastructure, and why I almost never type kubectl apply by hand.