[Extra] K8S Series Part 11 - ChatOps for a Homelab: A Cluster in Your Pocket
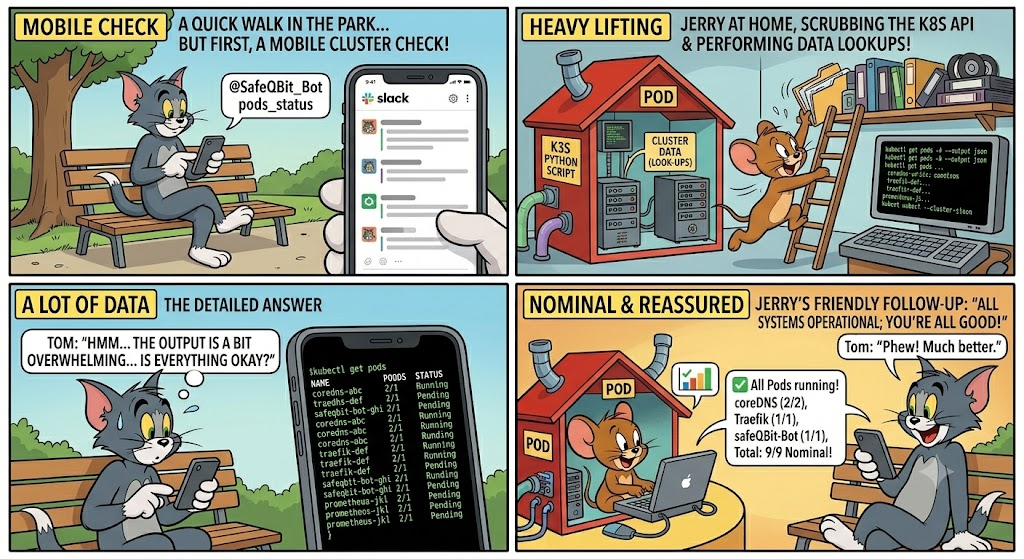
Article 10 was supposed to close this series. Then I built something in an afternoon that changed how I interact with the cluster more than anything since Flux, and it earned itself a follow-up.
This is the story of a ~600 line Python bot that lives in one pod, holds zero write permissions, and answers questions like "did last night's backups go green?" from my phone, in Slack, in about two seconds. But to explain why it matters, I have to start with what was already watching the cluster, and where all of that quietly falls short.
The watchers I already had
By now the cluster has a respectable monitoring stack. If you read article 10 you know the core of it:
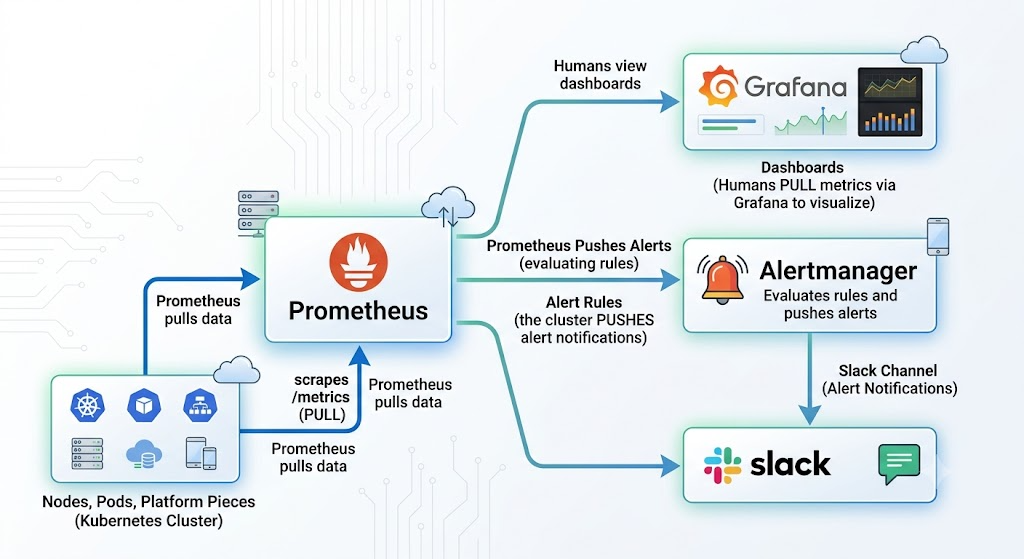
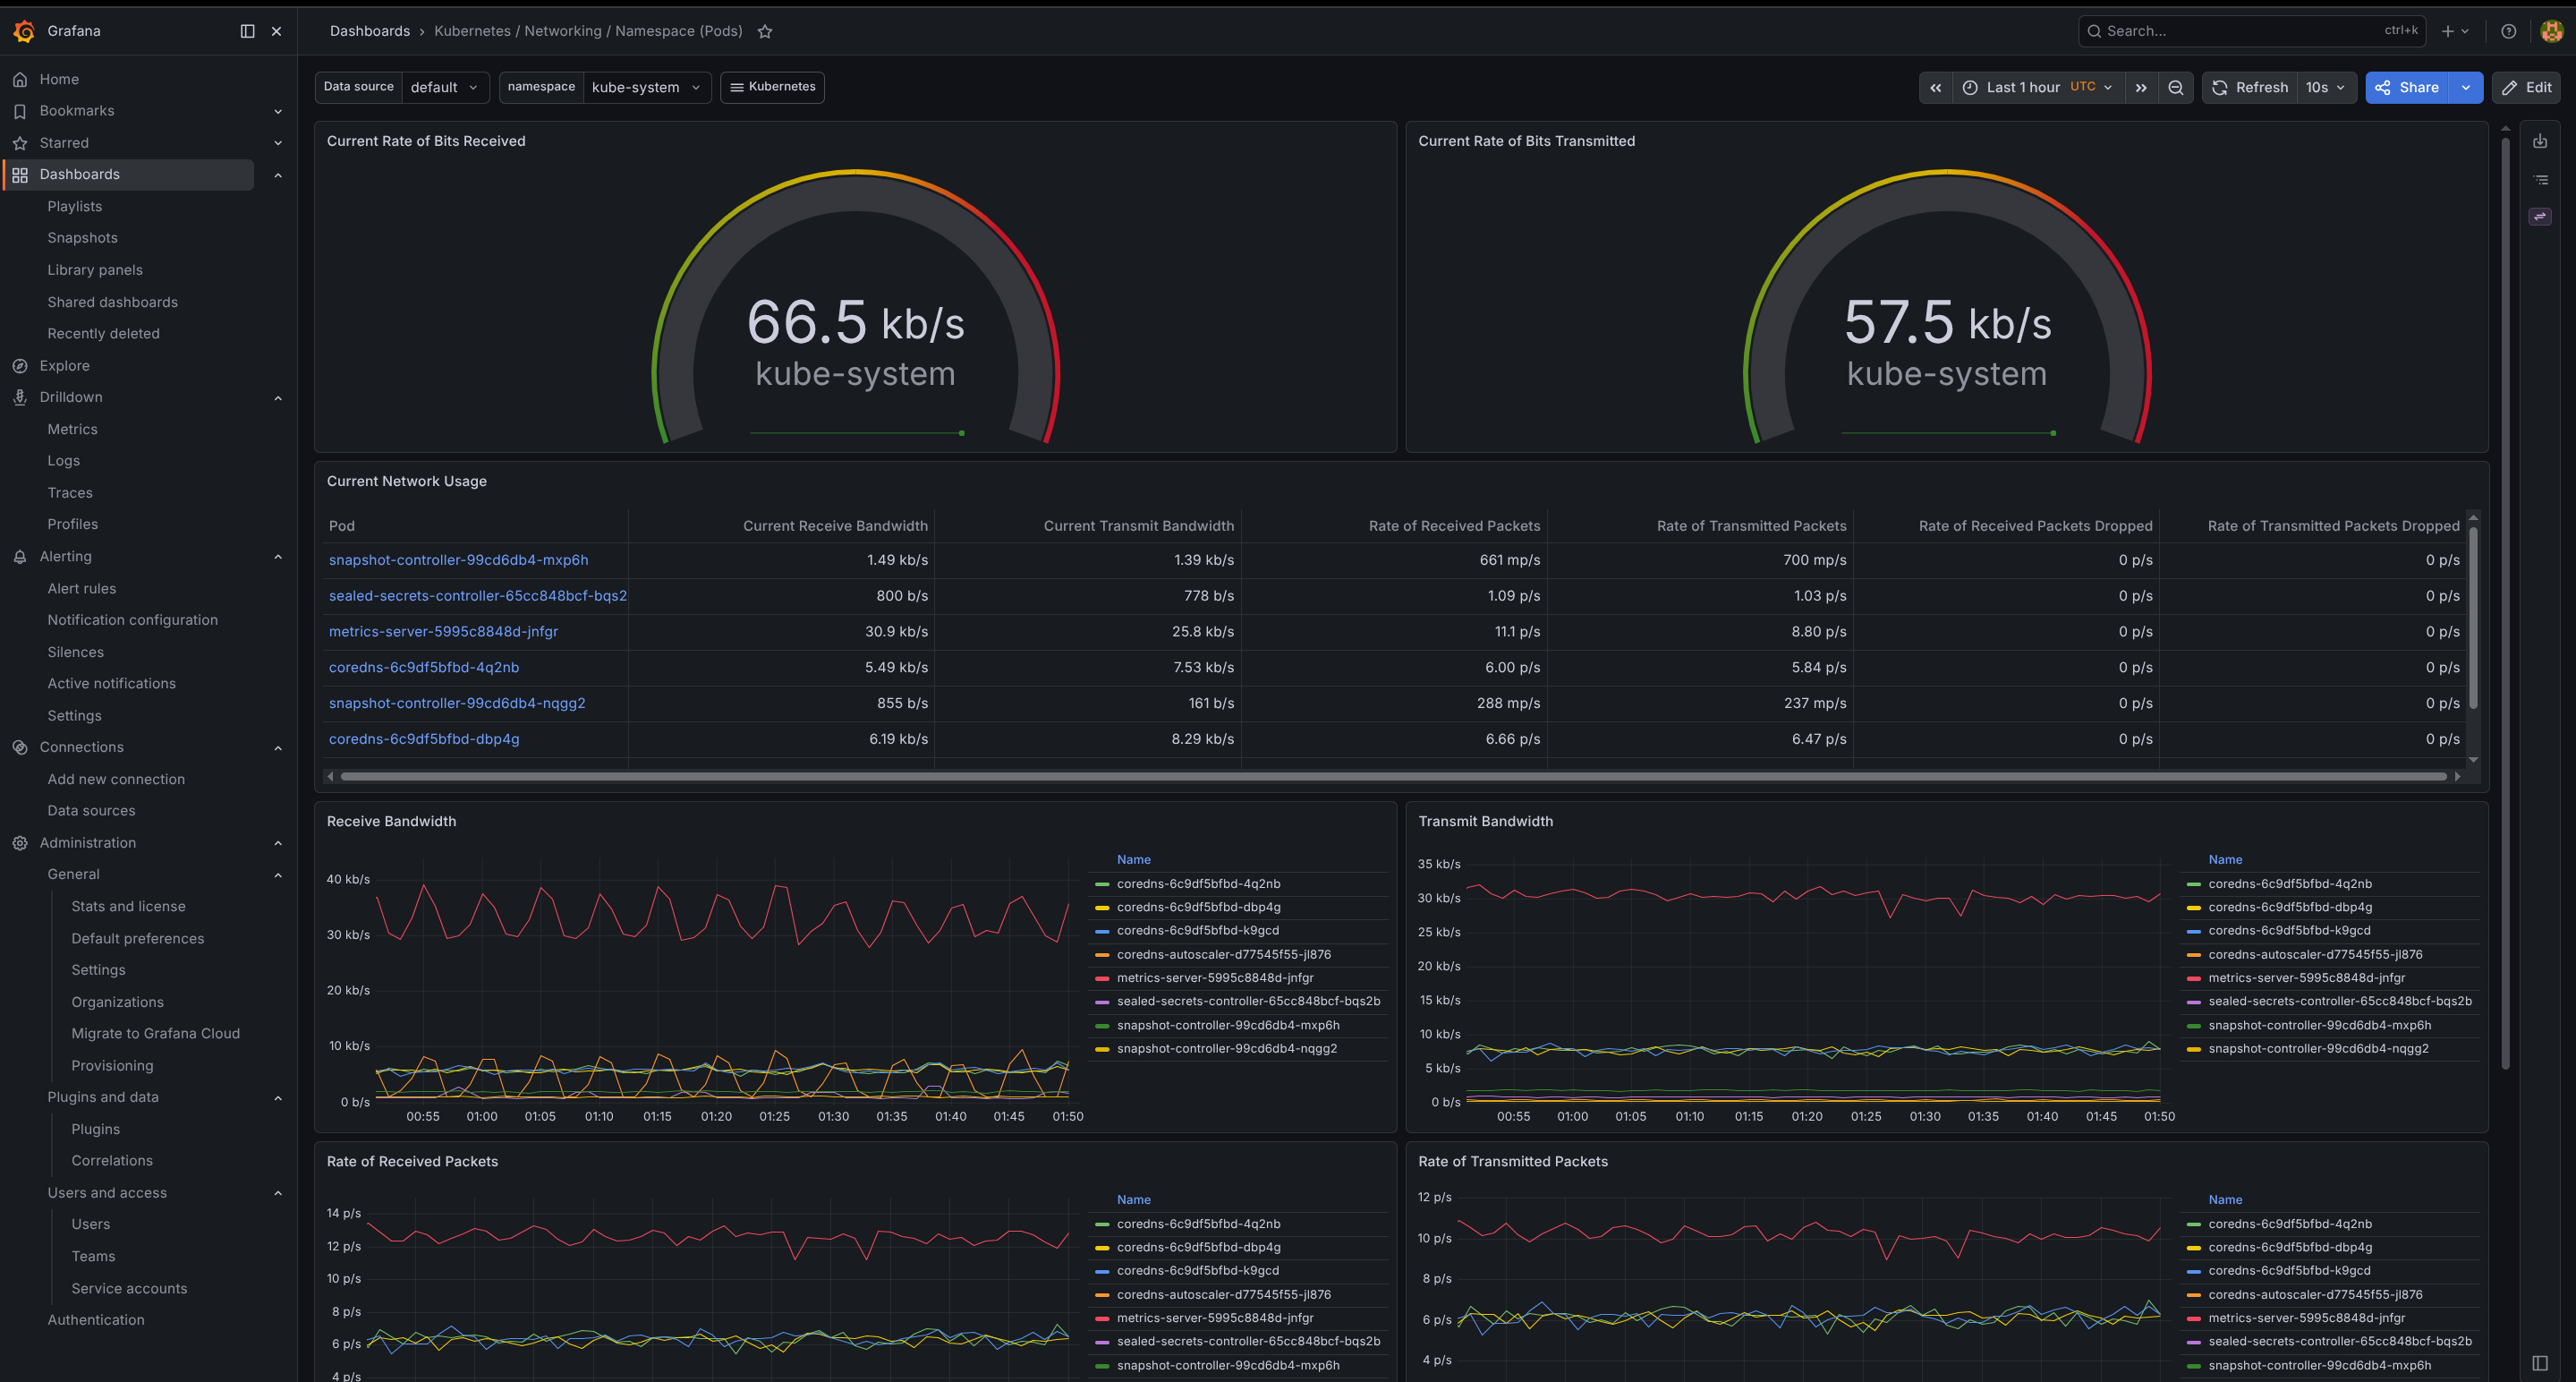
Prometheus scrapes everything every 30 seconds and remembers it. Grafana turns that history into dashboards I can stare at. Alertmanager watches the same numbers against rules and shouts into a Slack channel when something crosses a line - a volume degrading, a backup failing, a pod crash-looping.
On top of the core stack sit two more specialised watchers. Uptime Kuma does the simplest check that exists: is the thing up? It hits every app's HTTPS endpoint from inside the network and keeps a pretty status history. And Pulse gives me a single pane of glass across the whole homelab, not just Kubernetes: the Proxmox hosts the VMs run on, the k3s cluster itself, and the one remaining Docker host, all in one view.
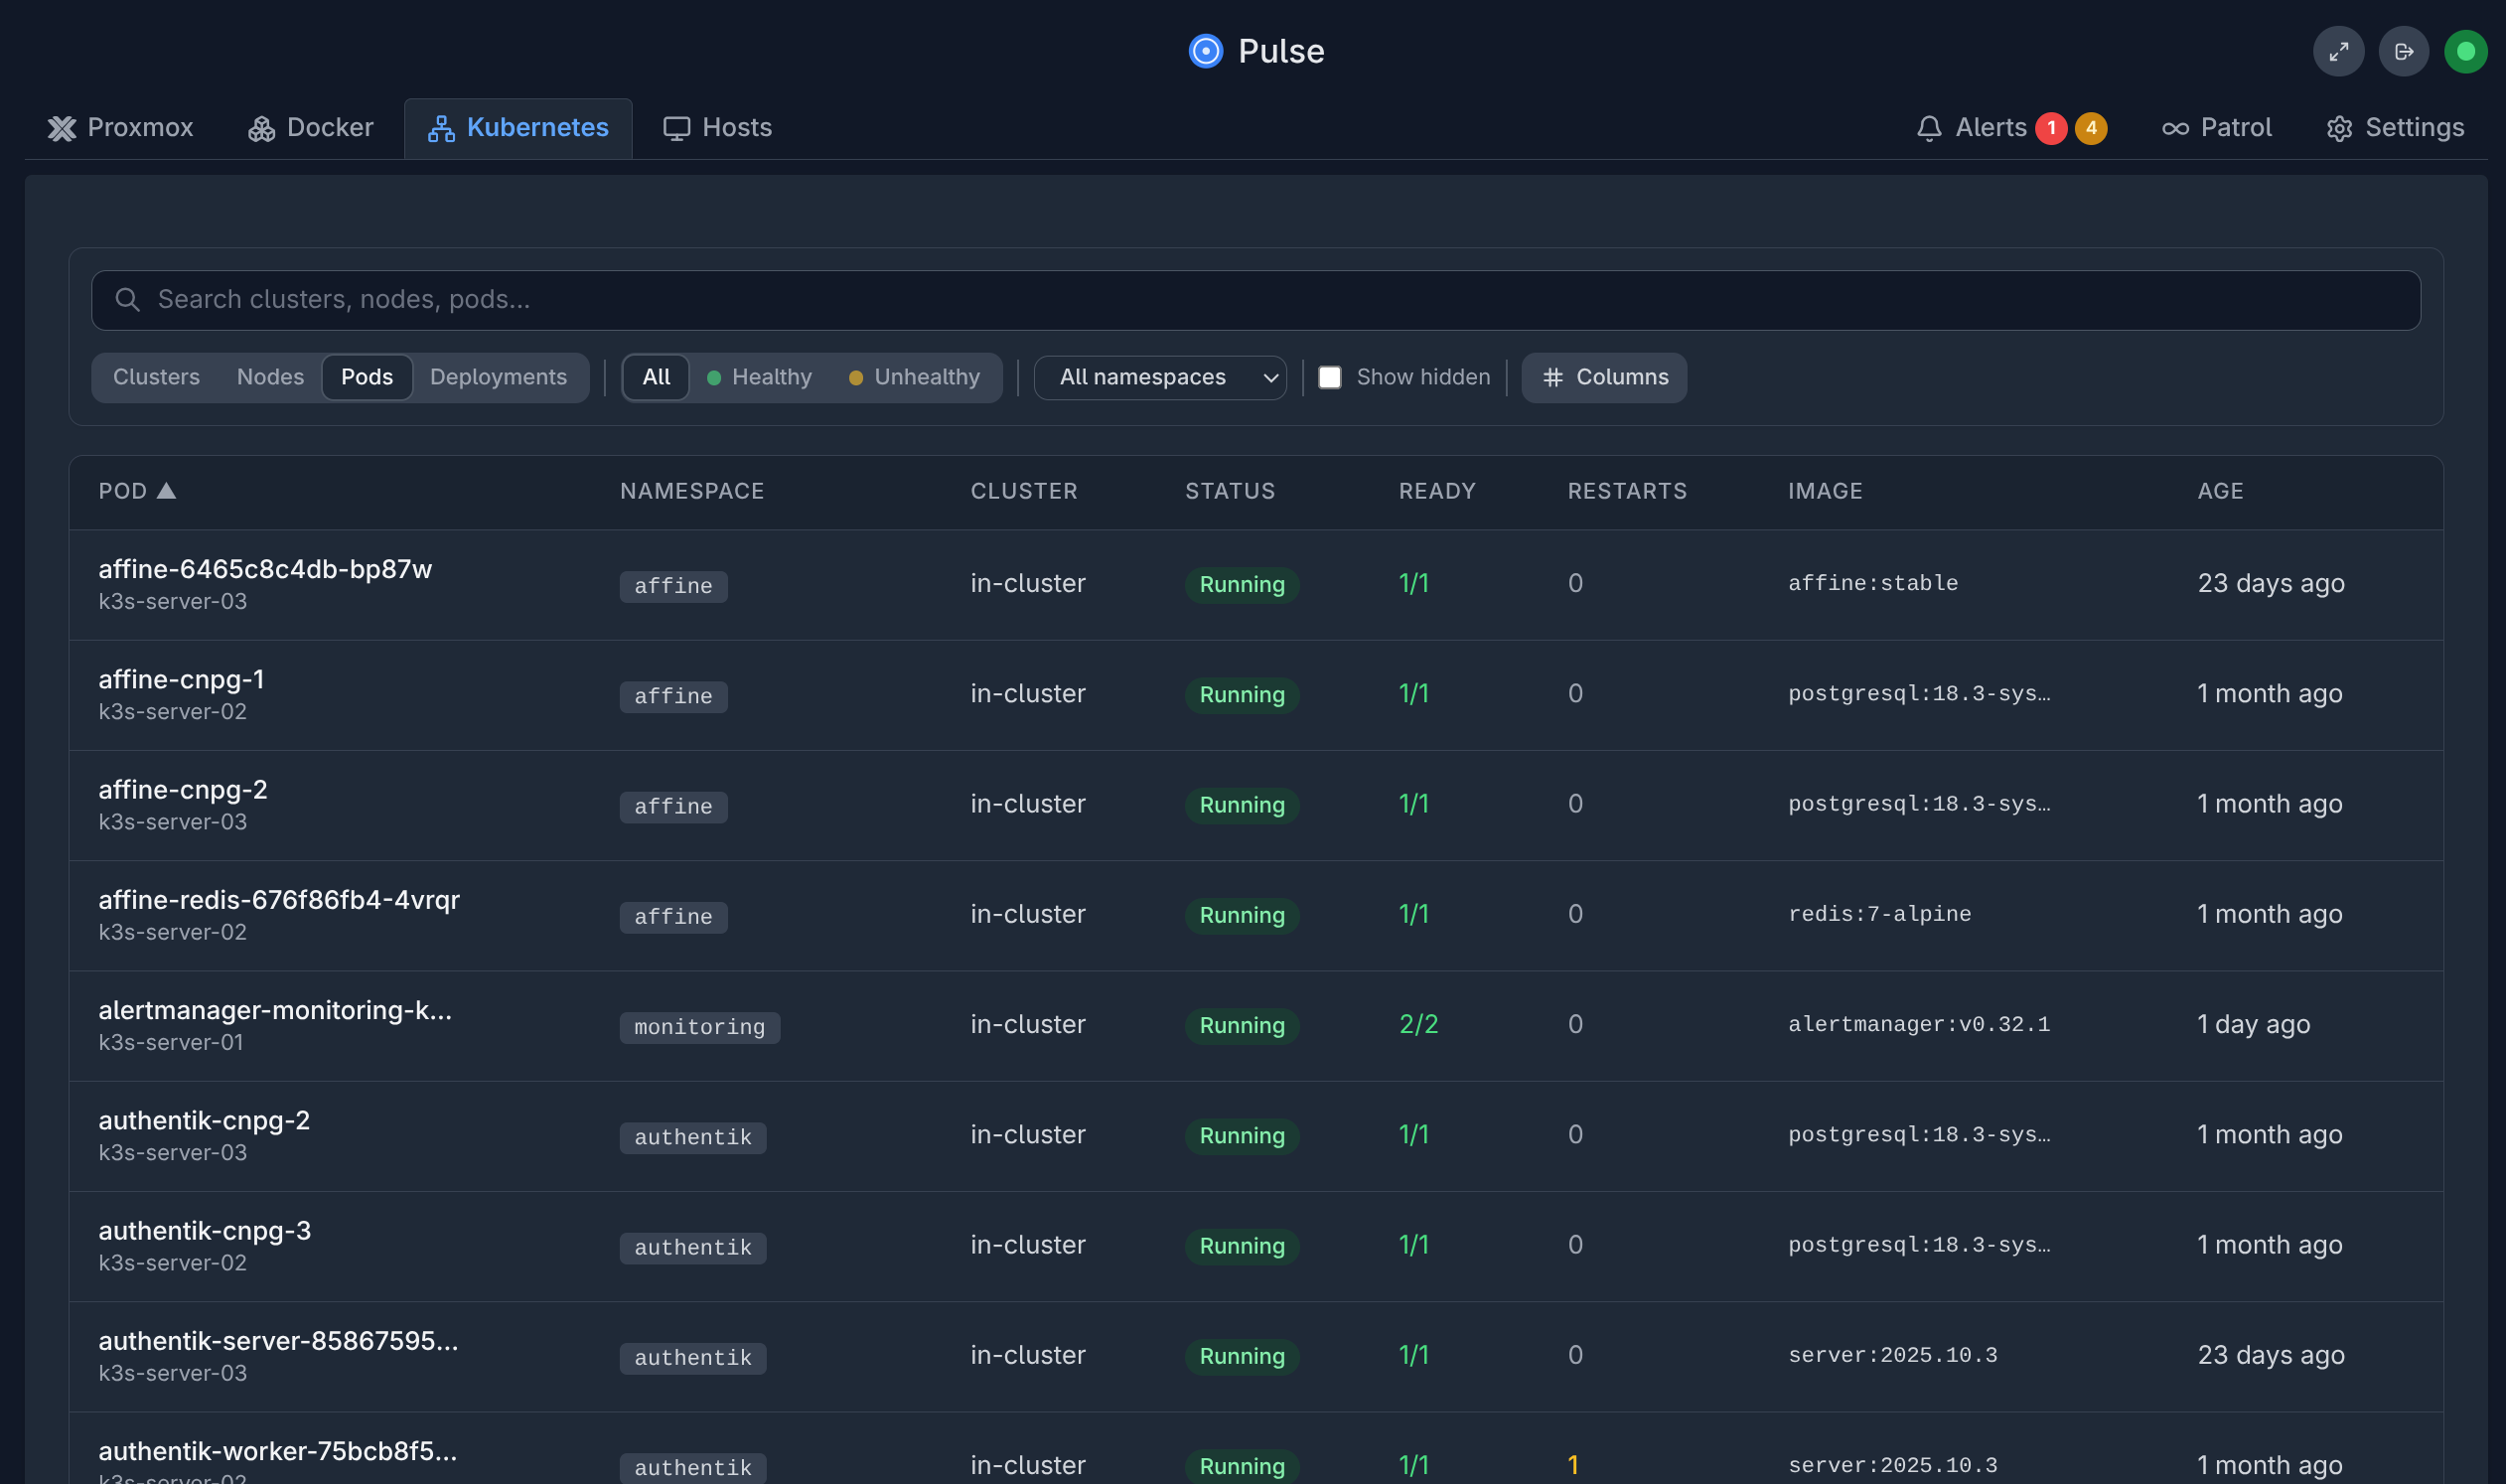
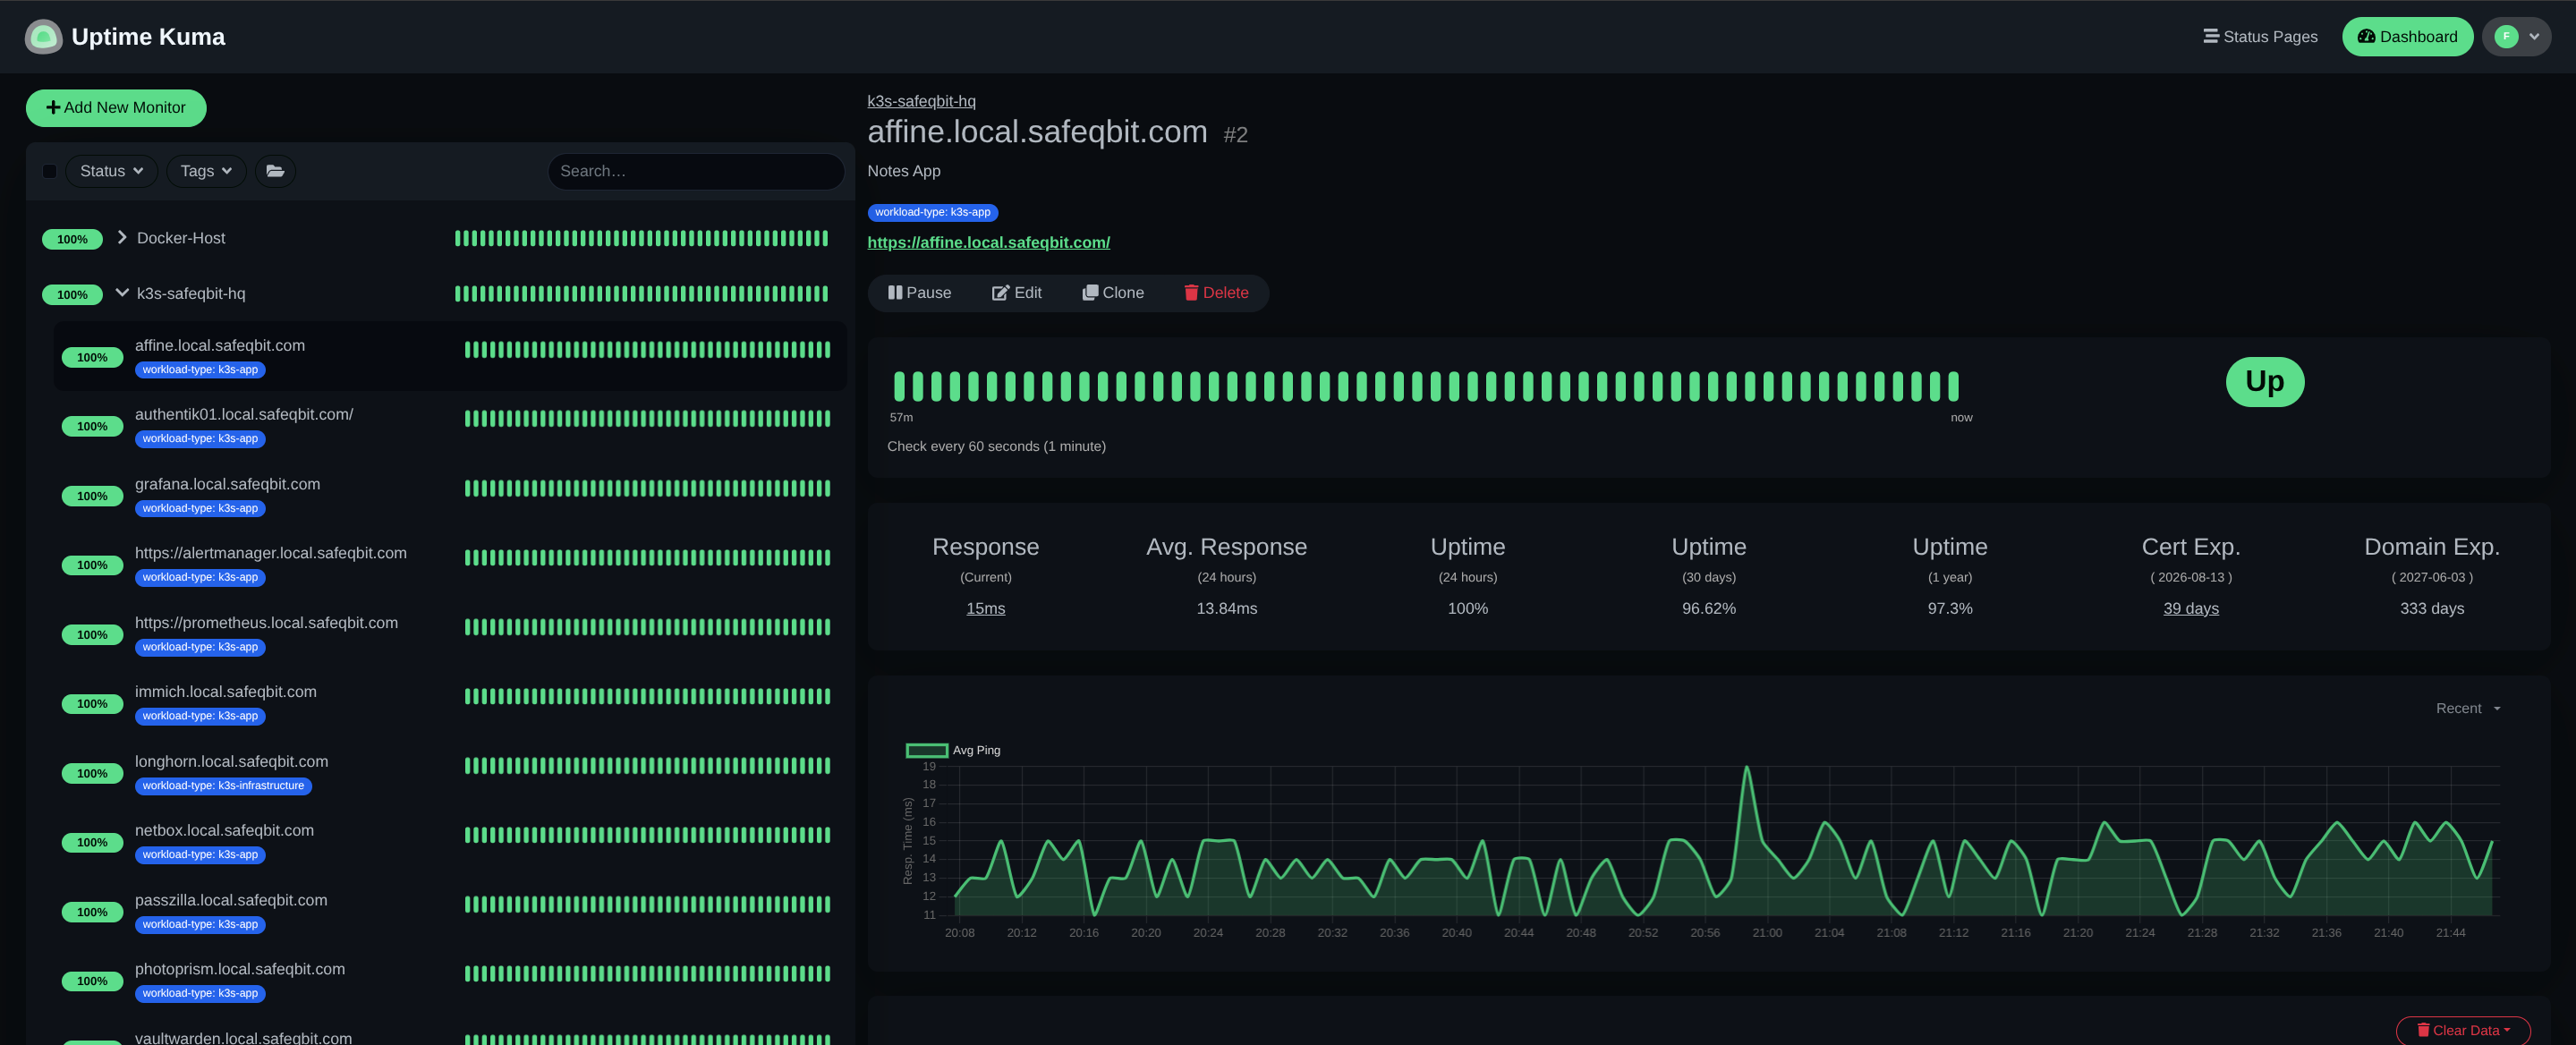
That's four tools, and I'd defend every one of them. But notice what they have in common.
How this actually plays out in real life
Monitoring tools split into two camps: the ones that push and the ones that wait.
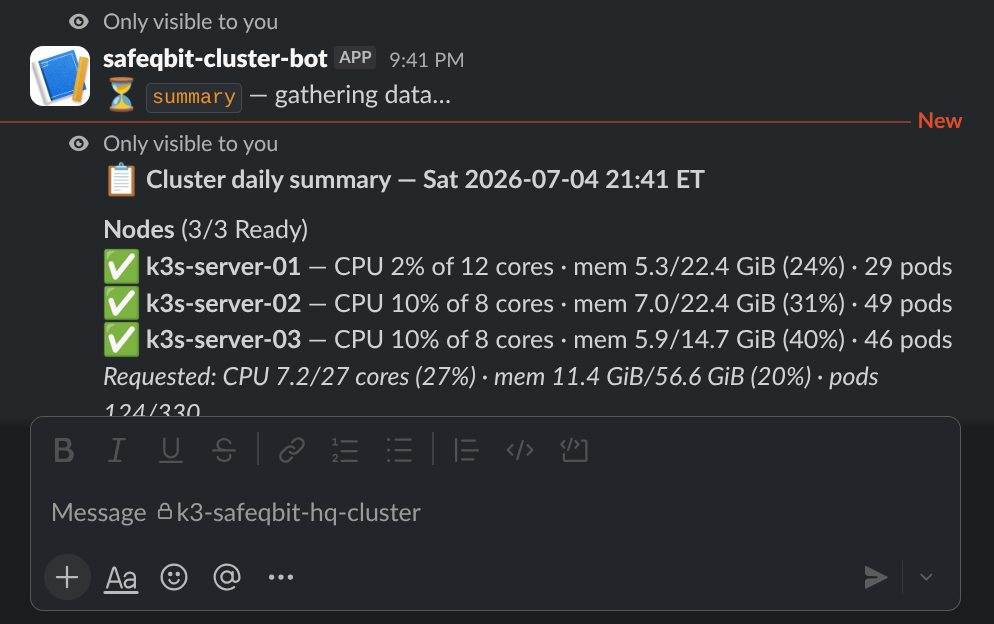
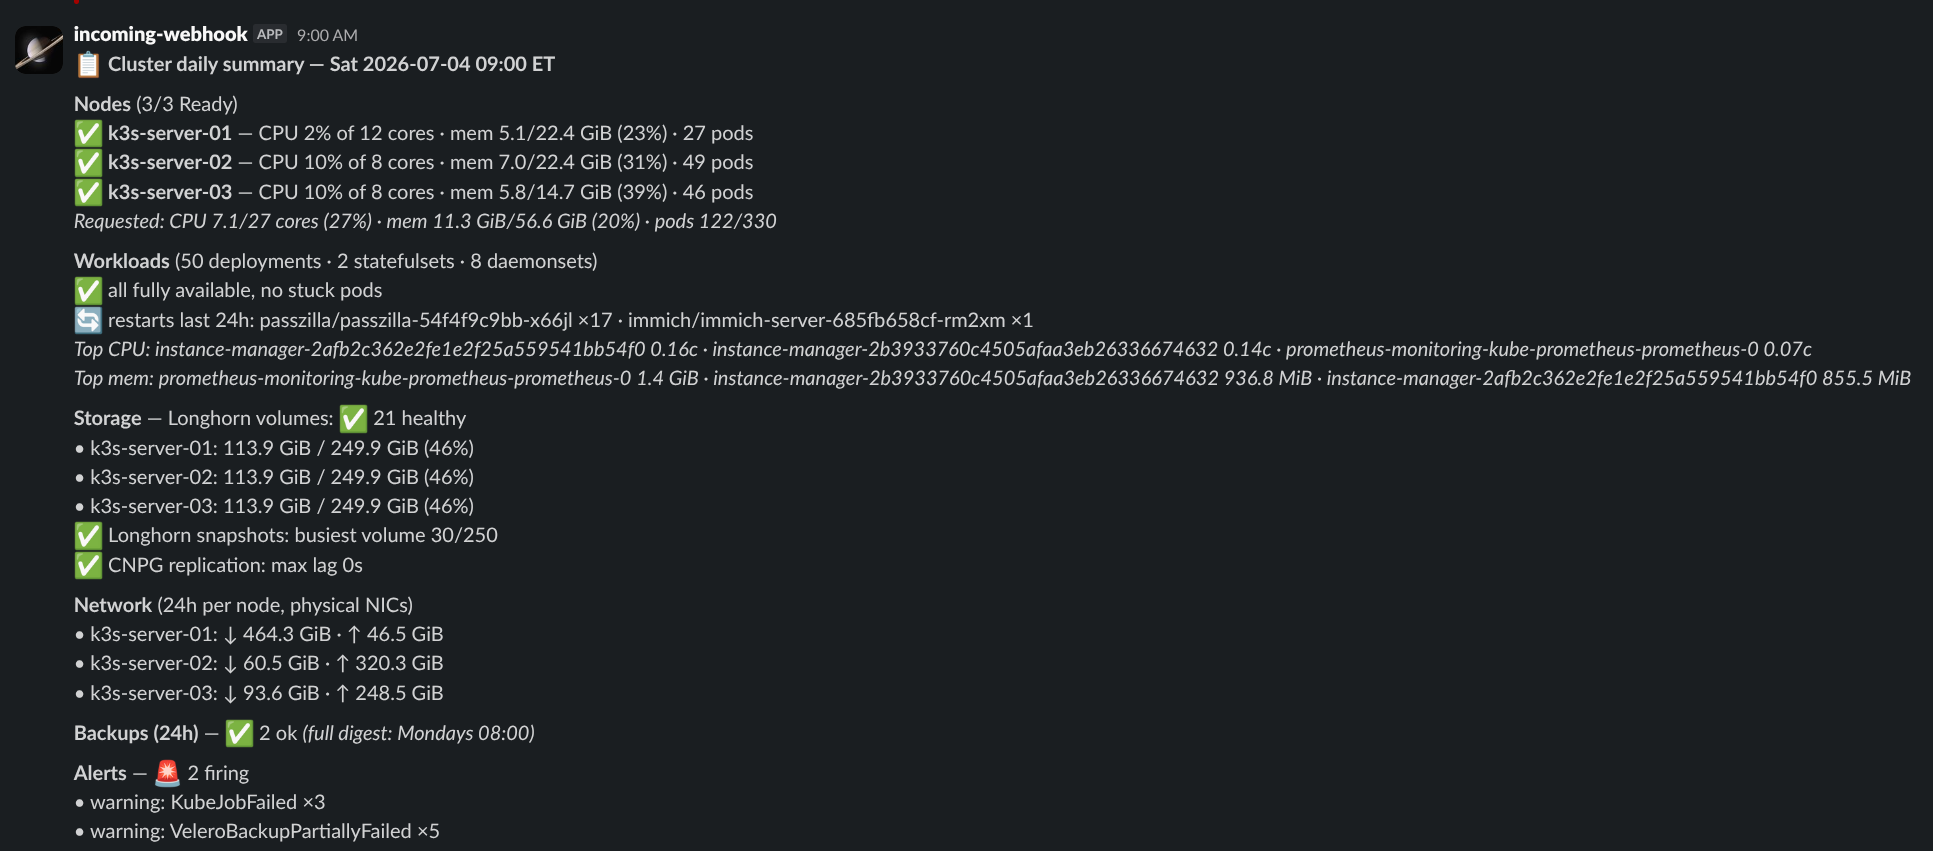
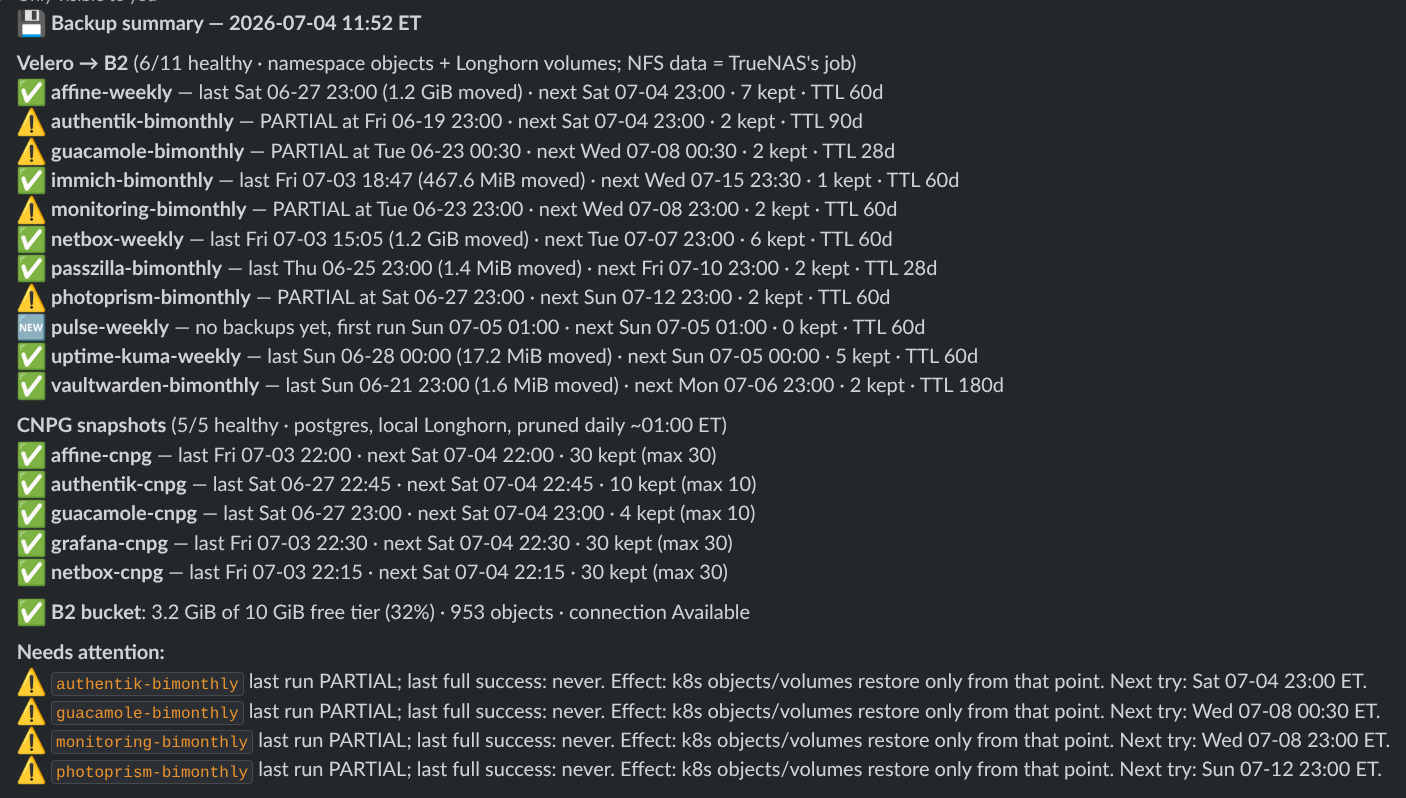
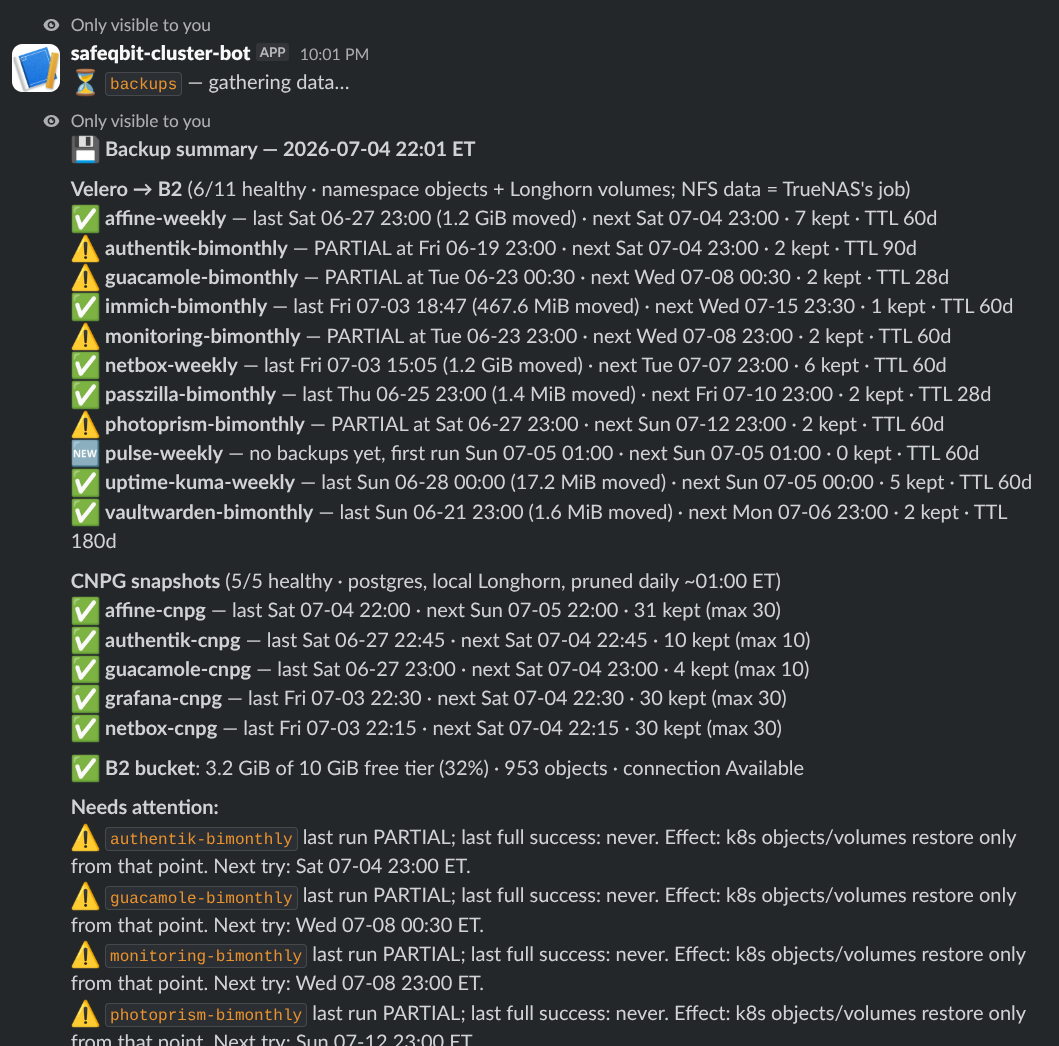
Alertmanager pushes. When something breaks, Slack buzzes, and that part works beautifully. I've also leaned into it further: the cluster now sends me two scheduled reports on top of the alerts. Every morning at 9am a daily cluster summary lands in Slack - node health, CPU and memory headroom, top consumers, storage, network, anything firing. Every Monday morning a backup digest follows it - every app, when it was last backed up, whether the run went green, what's scheduled next, even how much of the Backblaze bucket everything is eating. Both are CronJobs running plain Python against Prometheus and the Kubernetes API. The cluster talks to me without being asked.
Everything else waits. Grafana is glorious when I'm sitting at a laptop with a browser tab open. Uptime Kuma has a lovely status page that I have to go look at. Pulse shows everything on a screen I have to be in front of.
And here's the honest failure mode, which has nothing to do with the tools: an alert fires while I'm out. Say a Velero backup partially failed overnight, I saw the Slack notification at breakfast, I fixed the volume policy and kicked off a manual run before leaving. Now I'm in a supermarket queue wondering: did the re-run finish? Is it green?
My options in that queue used to be: wait until I'm home, or VPN in from a phone, open a terminal app, and type kubectl get backups.velero.io -n velero on a touch keyboard. I have done this. I do not recommend it.
The stack could tell me things on the go, but I couldn't ask it anything. Push worked; pull needed a desk.
The missing piece: asking questions from where I already am
The fix turned out to be embarrassingly obvious once I said it out loud: the alerts already live in Slack, the reports already live in Slack, I already live in Slack. So put the questions there too.
Meet /cluster:
Two seconds later, the same backup digest the Monday CronJob sends, generated fresh, visible only to me, in whatever channel I typed it. From the queue. Done wondering.
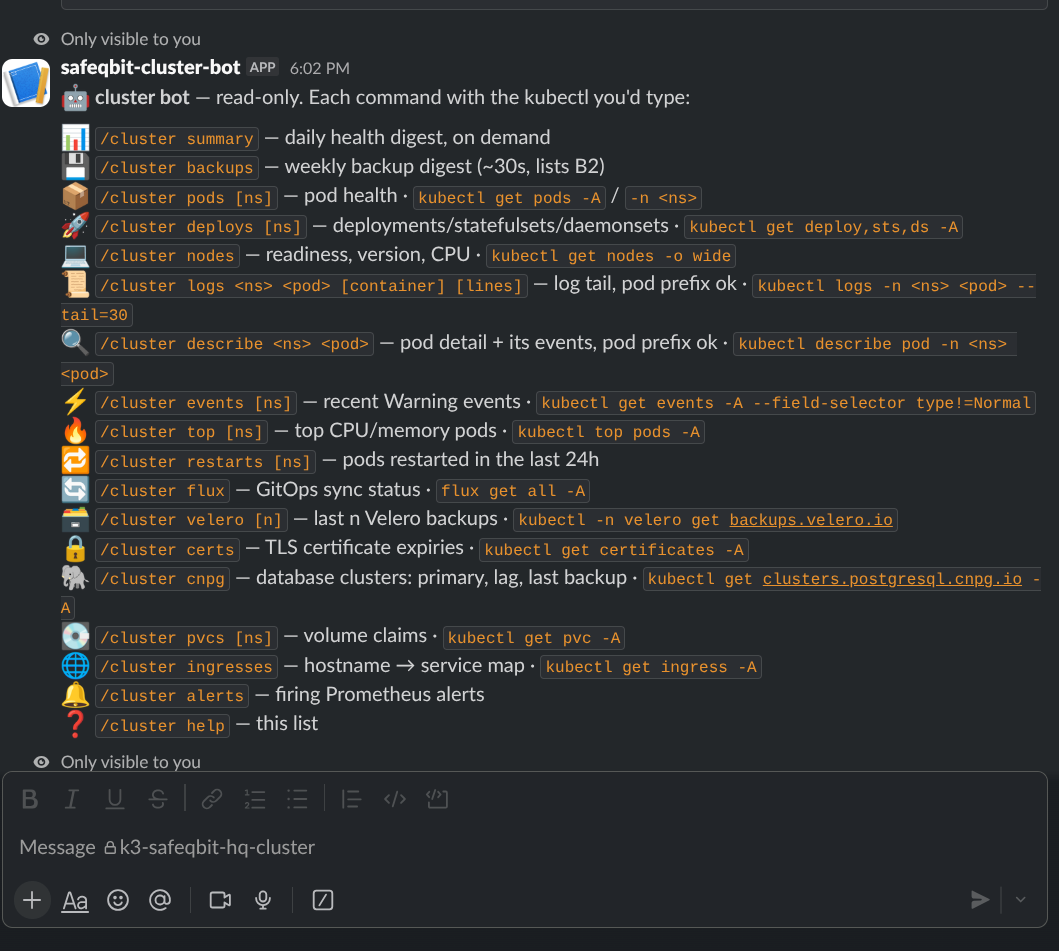
Typing /cluster help lists everything the bot can do, and there's a detail in that help text I'll get to later, because it's my favorite part.
How it works, and why nothing is exposed
My first reaction to "Slack bot for the cluster" was suspicion, because Slack slash commands classically work by Slack calling a public HTTPS endpoint that you host. This cluster is LAN-only. It stays LAN-only. Not negotiable.
The answer is Socket Mode: instead of Slack calling in, the bot dials out and holds a WebSocket open. Slash commands arrive over that outbound connection. No ingress, no tunnel, no port forward, nothing for the internet to find. And it's a free-tier Slack feature no subscription needed either.
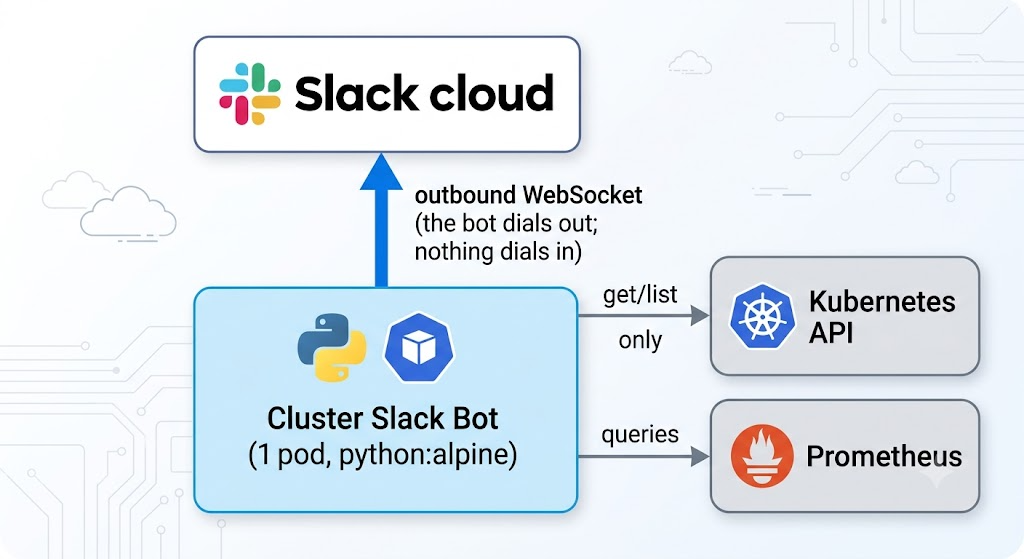
The security posture is the part I'm most deliberate about:
- Read-only RBAC, by design. The bot's ServiceAccount can
getandlist. It cannot delete a pod, scale a deployment, or restart anything. - Locked to my Slack member ID. Anyone else in the workspace gets a polite
"not authorized". - Tokens are SealedSecrets, same as every other credential in the repo (article 04). The Git history contains only ciphertext.
I also decided what the bot will never do: write commands. No /cluster restart, no /cluster reconcile. The temptation is real, and Slack even has confirmation buttons that would make it feel safe. But "feel" is the operative word. A read-only bot has a security story I can explain in one sentence; a bot with even one write verb needs a threat model. One sentence wins 😄
Chatbot commands tour
Seventeen commands as of v3. They cluster into four groups.
The reports, on demand. summary and backups are the exact same reports the CronJobs send on schedule - same code, same formatting - generated the moment I ask. More on how that works below.
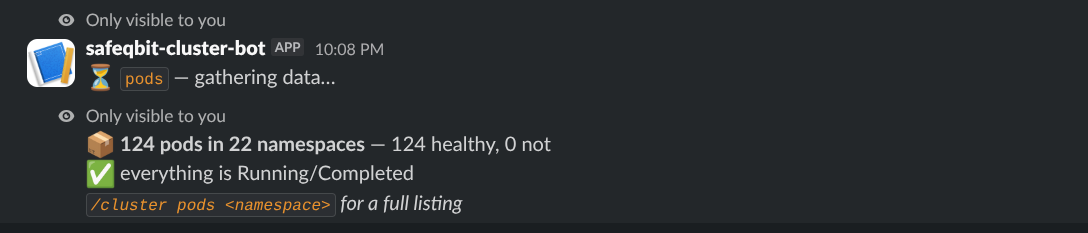
Fleet health. pods gives an all-namespace overview with the unhealthy ones called out (or a full listing for one namespace: /cluster pods velero). deploys shows deployments, statefulsets and daemonsets with ready-vs-desired counts, unhealthy sorted to the top. nodes covers readiness, versions and CPU load. restarts asks Prometheus which pods restarted in the last 24 hours, which catches the slow crash-loops that a point-in-time pod listing misses entirely.
The debugging trio. This is where it starts feeling like a terminal:
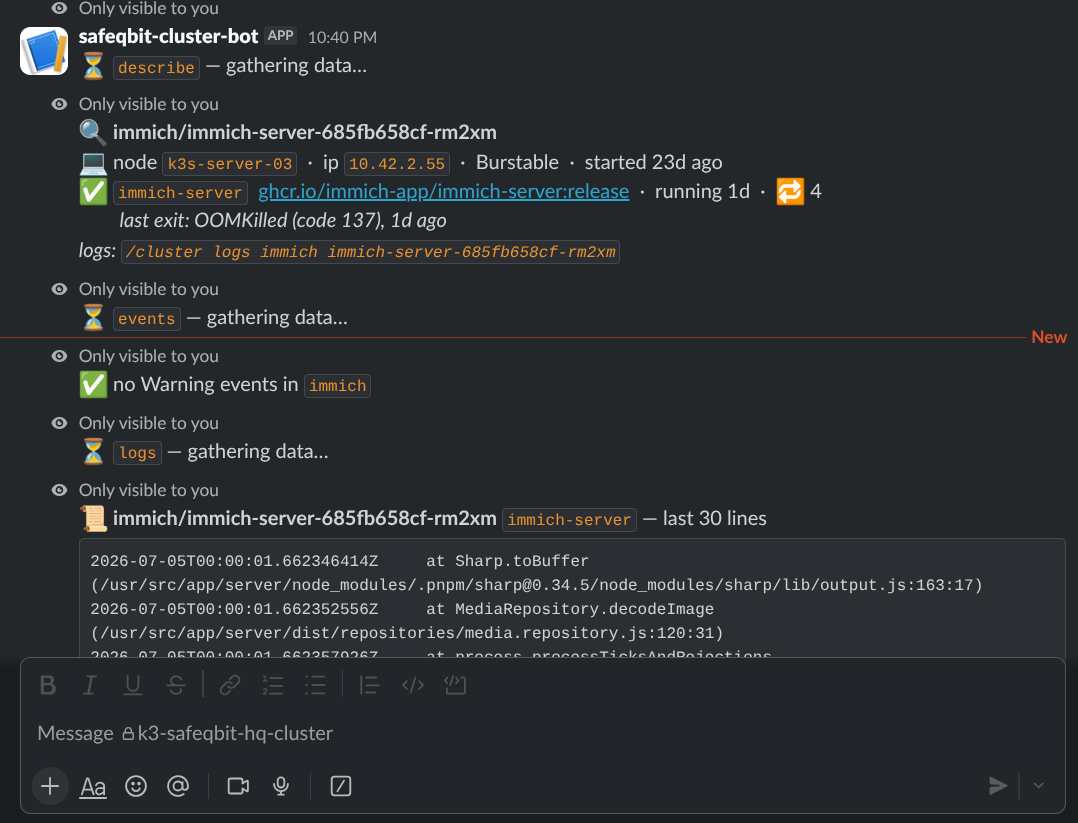
/cluster logs immich immich-server
/cluster describe immich immich-server
/cluster events immich
logs tails a pod's logs, and here's the quality-of-life feature I now can't live without: a pod name prefix is enough. Nobody remembers that the pod is called immich-server-685fb658cf-rm2xm. You type immich-server and the bot resolves it; if the prefix is ambiguous it lists the candidates instead of guessing. Multi-container pod? It replies with ready-to-paste commands, one per container. describe gives the pod detail that actually matters when debugging - which node, per-container state, restart counts with the last exit reason and code, plus that pod's recent events - and ends by handing you the matching logs command. top rounds it out with the ten hungriest pods by CPU and memory.
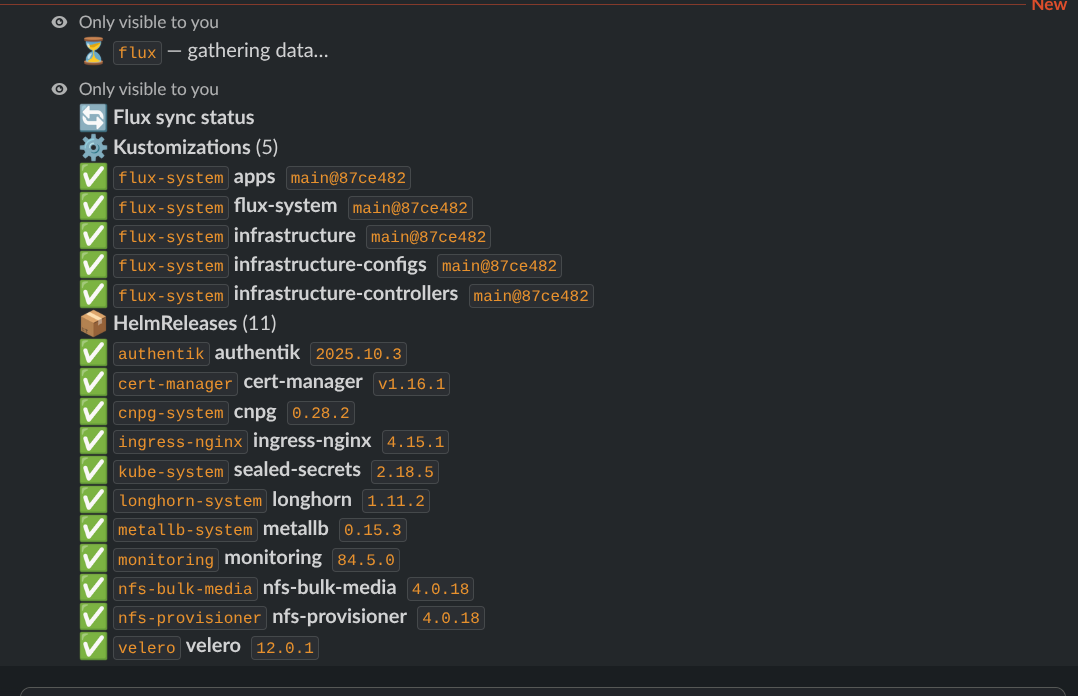
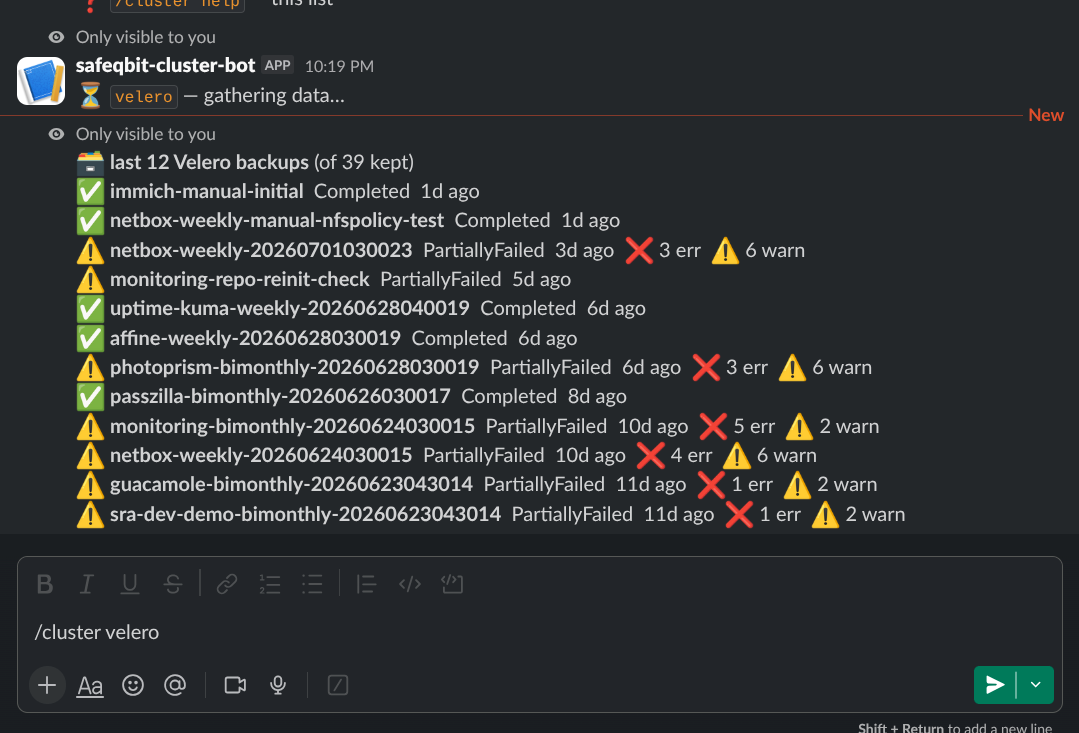
The platform layer. flux shows every Kustomization and HelmRelease with its ready state and applied Git revision, with the failure message inlined when something is stuck - it's flux get all for the phone, and since this whole cluster runs on "merge a PR and Flux applies it" (article 02), being able to confirm a merge landed from anywhere closes a loop that used to nag at me. velero lists recent backups with phases and error counts. certs shows TLS certificate expiries, soonest first, coloured red under 7 days. cnpg covers the databases: ready instances, current primary, replication lag, last successful backup. pvcs and ingresses and alerts do exactly what they say.
A nice accident from the first smoke test: /cluster flux flagged a Kustomization as not ready with "dependency not ready" as the message. It had caught its own deployment mid-reconcile. Thirty seconds later everything was green. The bot's first finding was itself, which felt appropriate.
And the help text detail I promised: every entry in /cluster help shows the kubectl command you'd type on a real terminal to get the same answer:
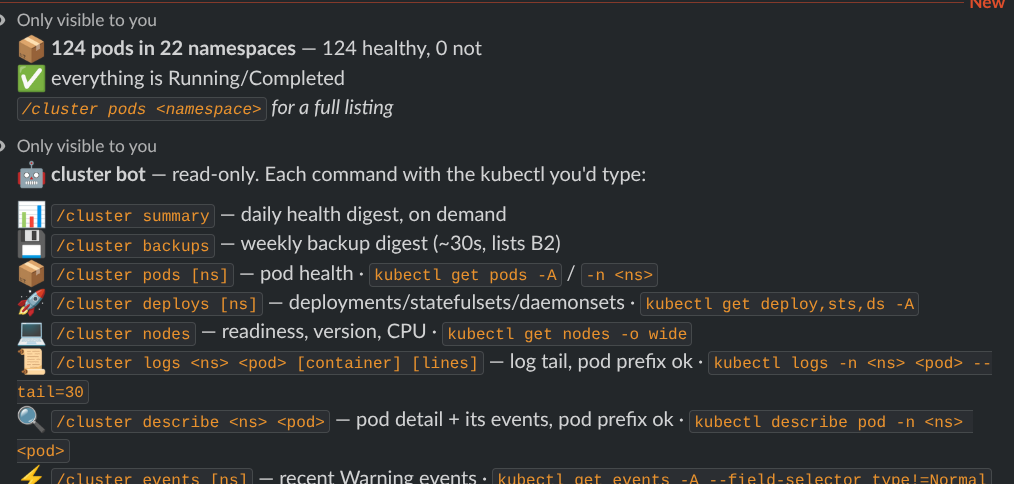
So the bot doubles as a cheat sheet. If you're the kind of person who learns tools by using them, the help text quietly teaches you the underlying kubectl the whole time.
The trick that kept it small
My favourite implementation detail. The daily summary and the backup digest already existed as scheduled CronJobs, each a self-contained Python script in a ConfigMap that builds a report and POSTs it to a Slack webhook URL taken from an environment variable.
When Slack delivers a slash command, it includes a response_url: a short-lived webhook that posts back to wherever the command was typed. See where this is going?
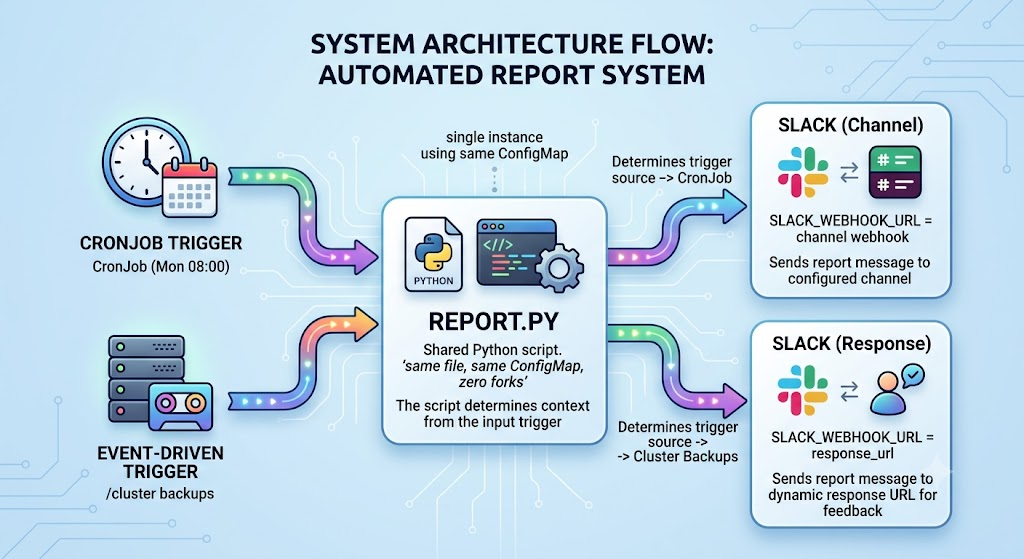
The bot mounts the same ConfigMaps the CronJobs use and runs the scripts as subprocesses with SLACK_WEBHOOK_URL pointed at the response_url. One copy of the report code, two delivery modes. When I improve the scheduled report, the on-demand version improves in the same commit, and neither knows the other exists.
What it cost
The bill, in full: one Deployment on python:3.13-alpine that pip-installs a pinned slack-bolt at startup (no custom image, no registry to run), one ConfigMap holding the bot script, one SealedSecret with two Slack tokens, and a strictly read-only ClusterRole. The Slack side is free tier: a custom app, Socket Mode, one slash command. Requests 10m CPU and 64Mi of memory, which is to say: nothing.
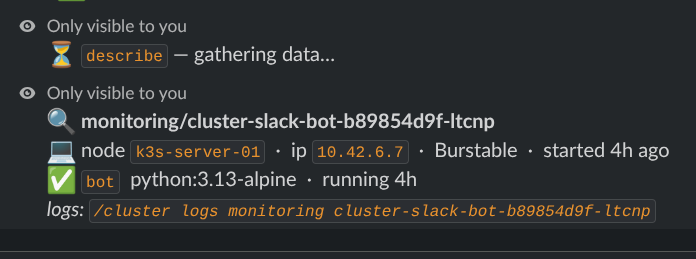
For that I got the thing none of the four watchers gave me. Prometheus remembers, Grafana shows, Alertmanager and the scheduled reports push, Uptime Kuma and Pulse watch. The bot answers. It turned my monitoring stack from a set of screens I have to visit into a conversation I'm already in.
The supermarket queue test, for the record: /cluster velero, thumb-typed, answered before I reached the till. Green.
The repo with the bot manifest, the report scripts and everything else from this
series: k3s-safeqbit-local-hq.