K8S Series Part 10 - Cluster Monitoring and External Access
Two final pieces round out the cluster, and they're two sides of the same coin -visibility and reach. Observability and monitoring is how I know what's happening inside.
The tunnels are how a chosen few apps safely reach the outside world.
This article covers both, and closes the series.
Part 1 - Monitoring: knowing what's going on
A self-healing cluster is great until something breaks in a way it can't heal, and you find out from a family member saying "the photos app is down." Observability is how I find out first, and how I understand why.
I run the kube-prometheus-stack, a Helm chart (deployed via a HelmRelease, article 02) that bundles the whole monitoring toolchain:
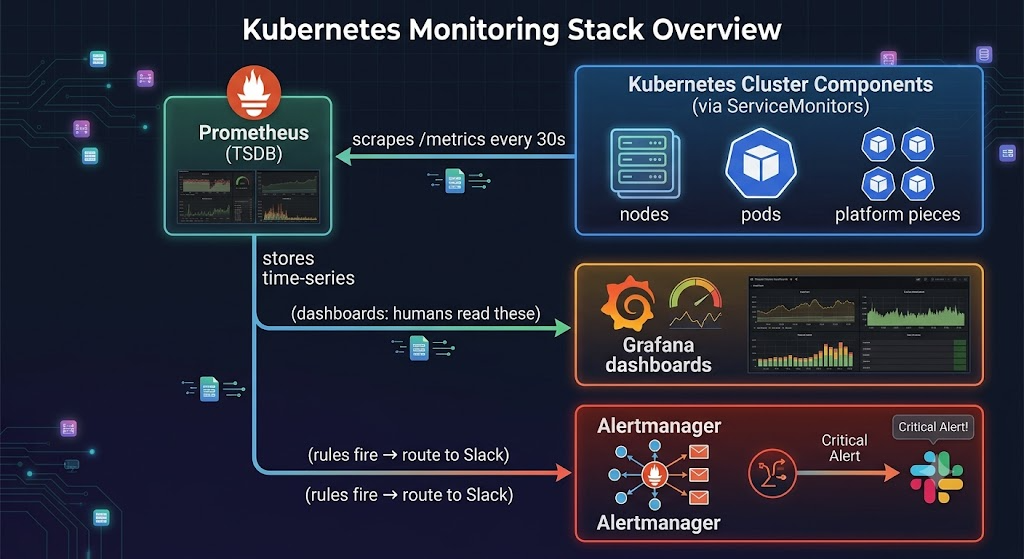
Prometheus - the metrics engine
Prometheus pulls metrics: each component exposes a /metrics endpoint, and Prometheus scrapes them on an interval, storing the numbers as time-series. What gets scraped is declared with ServiceMonitor objects (themselves custom resources), so adding a new scrape target is - of course - a committed YAML file:
apiVersion: monitoring.coreos.com/v1
kind: ServiceMonitor
metadata:
  name: cloudflared
  namespace: cloudflared
spec:
  selector:
    matchLabels: { app: cloudflared }
  endpoints:
    - port: metrics
      interval: 30s
I scrape the platform itself (ingress-nginx, cert-manager, sealed-secrets, CNPG, the cloudflared tunnels) plus node-exporter (host CPU/mem/disk) and kube-state-metrics(object state - how many pods Ready, etc.).
Grafana - the dashboards
Grafana turns those time-series into dashboards. Mine cover cluster-wide resource usage, per-namespace workloads, and node-level OS metrics. A detail that matters for GitOps: dashboards and datasources are provisioned from ConfigMaps, so they're version-controlled like everything else - not clicked together in a UI and lost on the next rebuild.
Grafana is also the app whose failure taught me to take its own database seriously: on SQLite-over-NFS it hit SQLITE_BUSY deadlocks under Grafana's background jobs. Moving it to a CNPG Postgres pair (article 06) fixed it. The monitoring system needs to be more reliable than the things it monitors.
Alertmanager - telling me before I'd notice
Metrics are passive; alerts are active. Prometheus evaluates alert rules and, when one fires, hands it to Alertmanager, which routes a notification - in my case to Slack via a webhook (stored, naturally, as a SealedSecret).
# a PrometheusRule - one of several covering nodes, workloads, and tunnels
groups:
  - name: cloudflared
    rules:
      - alert: CloudflaredTunnelDown
        expr: |
          kube_deployment_status_replicas_available{namespace="cloudflared"} == 0
        for: 2m
        labels: { severity: critical }
        annotations:
          summary: "A Cloudflare tunnel has no available replicas"
My rules cover the things that actually page me: a node going NotReady, a workload with no available replicas, CNPG replication lag climbing (a standby falling behind can't fail over cleanly - article 06), a tunnel dropping, a pod crash-looping. The goal is to hear about problems from Slack, not from a person.
The observability workflow
When an alert fires, the loop ties back to article 01:
Slack alert ─► Grafana (what's the shape/scope?) ─► kubectl describe/logs (root cause)
Grafana tells me what and how bad; kubectl tells me why. Metrics narrow the search; the funnel from article 01 finishes it.
Part 2 - Cloudflare Tunnels: reach without exposure
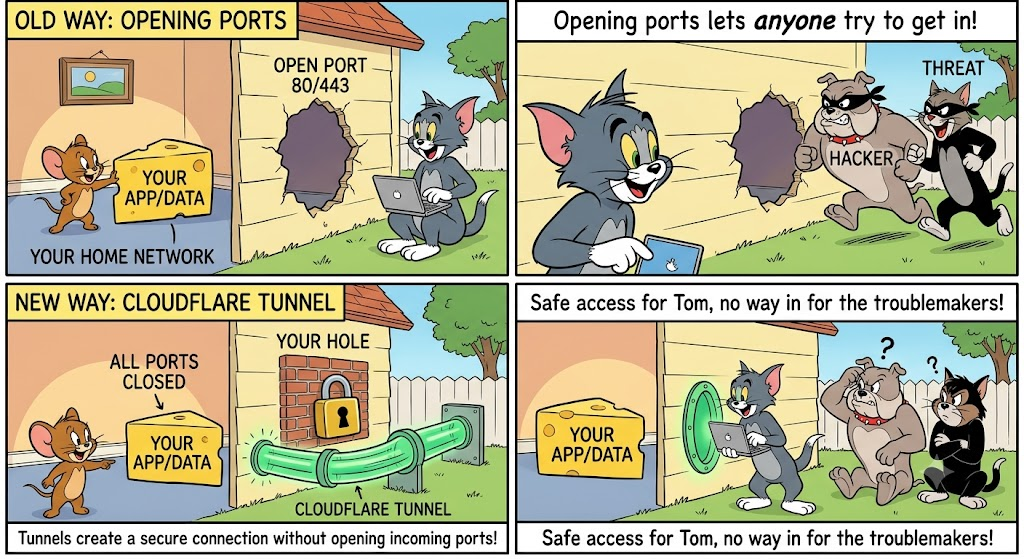
Most of my apps are LAN-only. A few need to be reachable from anywhere, public-facing things like a one-time-secret sharer or this blog site that you're reading. The traditional way is to forward ports on the router, which means opening inbound holes into my home network and putting the apps directly in the line of fire of the public internet. I don't do that. It is 2026 and IMO no one should allow inbound access, there are better and more secure ways to do it.
Instead I use Cloudflare Tunnels (cloudflared), and the key property is that they're outbound-only.
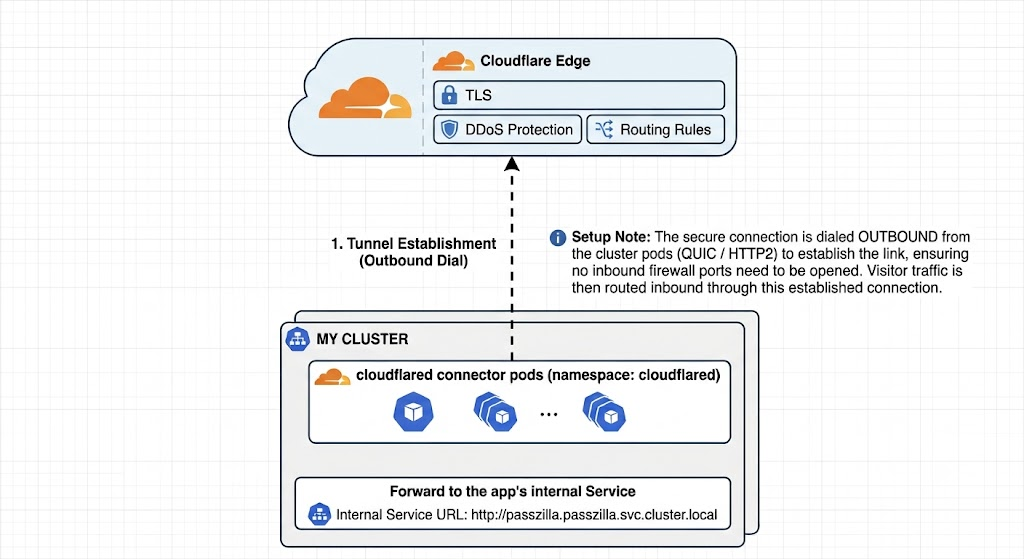
The connector pods dial out to Cloudflare and hold the connection open; visitor traffic comes back down that same outbound link. From my router's perspective, there is nothing listening for inbound connections - no port-forwards, no exposed LoadBalancer, no attack surface to scan. That's the entire reason I chose this over port-forwarding, and it lines up with zero-trust / attack-surface-reduction guidance (NIST SP 800-207).
Monitoring the tunnels
The tunnels expose Prometheus metrics, so they fold right into Part 1:
| Metric | Meaning |
|---|---|
cloudflared_tunnel_ha_connections |
Active edge connections (healthy ≈ 4 per pod) |
cloudflared_tunnel_total_requests |
Requests proxied since start |
cloudflared_tunnel_request_errors |
Failed proxy attempts |
If ha_connections looks healthy but total_requests stays flat, that's the signature of the upstream routing problem above - not a local fault.
Closing the series
Ten articles in, here's the whole thing in one simplified diagram:
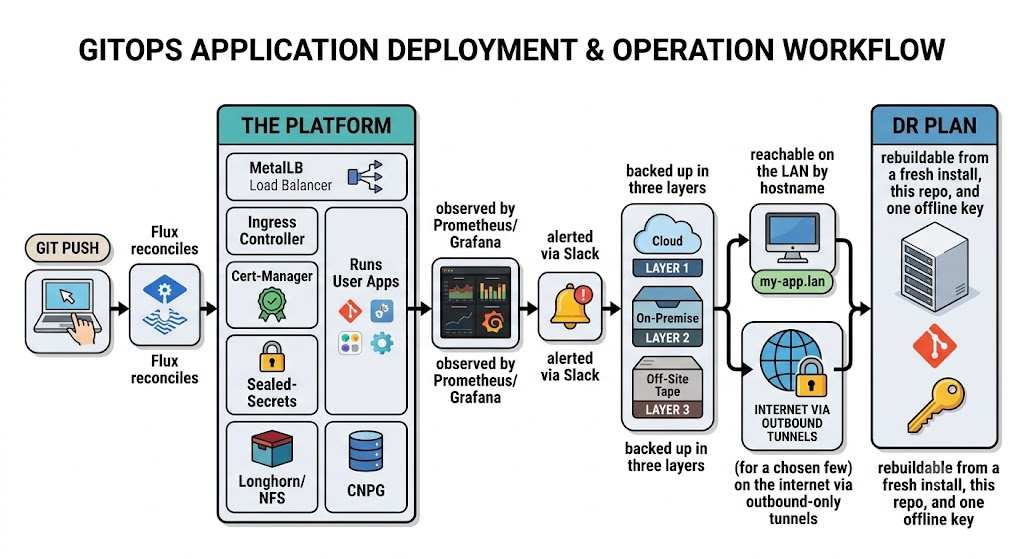
None of it is exotic individually. The value is in the composition: each piece declared in Git, each reinforcing the others, no single point that can quietly take everything down or lose my data. And building it has taught me more about Kubernetes, networking, storage, and operations than any course could - which was always half the point.
If you're building something similar, I hope the scars in these articles save you a few of your own. Thanks for reading.
Resources
This cluster
- k3s-safeqbit-local-hq repo - monitoring config and
PrometheusRules ininfrastructure/.../configs/; the tunnels inapps/safeqbit-local-hq/cloudflared/
Observability
- Prometheus documentation - scraping, PromQL, alert rules
- Grafana documentation - dashboards and provisioning
- Alertmanager - routing and the Slack receiver
- kube-prometheus-stack chart - the bundle I deploy
- Prometheus Operator: ServiceMonitor - declaring scrape targets
External access
- Cloudflare Tunnel documentation - outbound-only connectors
- Running cloudflared in Kubernetes
- NIST SP 800-207: Zero Trust Architecture - the attack-surface rationale
Just a few final thoughts to wrap this up. Six months ago, my Kubernetes knowledge was pretty minimal. A lot of folks told me to stick to a simple Docker setup and warned me against overcomplicating my home services with K8s. But I’m so glad I trusted my gut and pushed through. I spent countless hours deploying, testing, inevitably breaking things, and experimenting. Honestly, getting your hands dirty is the best way to learn and it’s exactly why we pour so much time and money into this homelabbing hobby. The services running on my cluster aren't just there to look good in a GitHub repository. They are real, everyday tools that my family rely on. When they need to use a service, they expect it to just work. That expectation is exactly why I’ve obsessed over refining this setup and building in genuine resilience against failure. Kubernetes isn't easy, and it certainly isn't trivial, but it’s entirely within your grasp if you're willing to put in the time and sweat to truly learn the technology.
That's the whole series. Thanks for following along 🙂